Shiba Inu, Algorand, MANA Price Analysis: 04 January

While Bitcoin’s price action stayed below its 4-hour 20-50-200 SMA, Shiba Inu and MANA’s near-term technical indicators exhibited a bearish inclination.
The meme coin seemed to hold the 61.8% Fibonacci support. Unless SHIB bulls dwindle, it headed toward a likely near-term consolidation. Algorand, however, kept its 20 SMA above the 50-200 SMA after indicating a bullish edge.
Shiba Inu (SHIB)
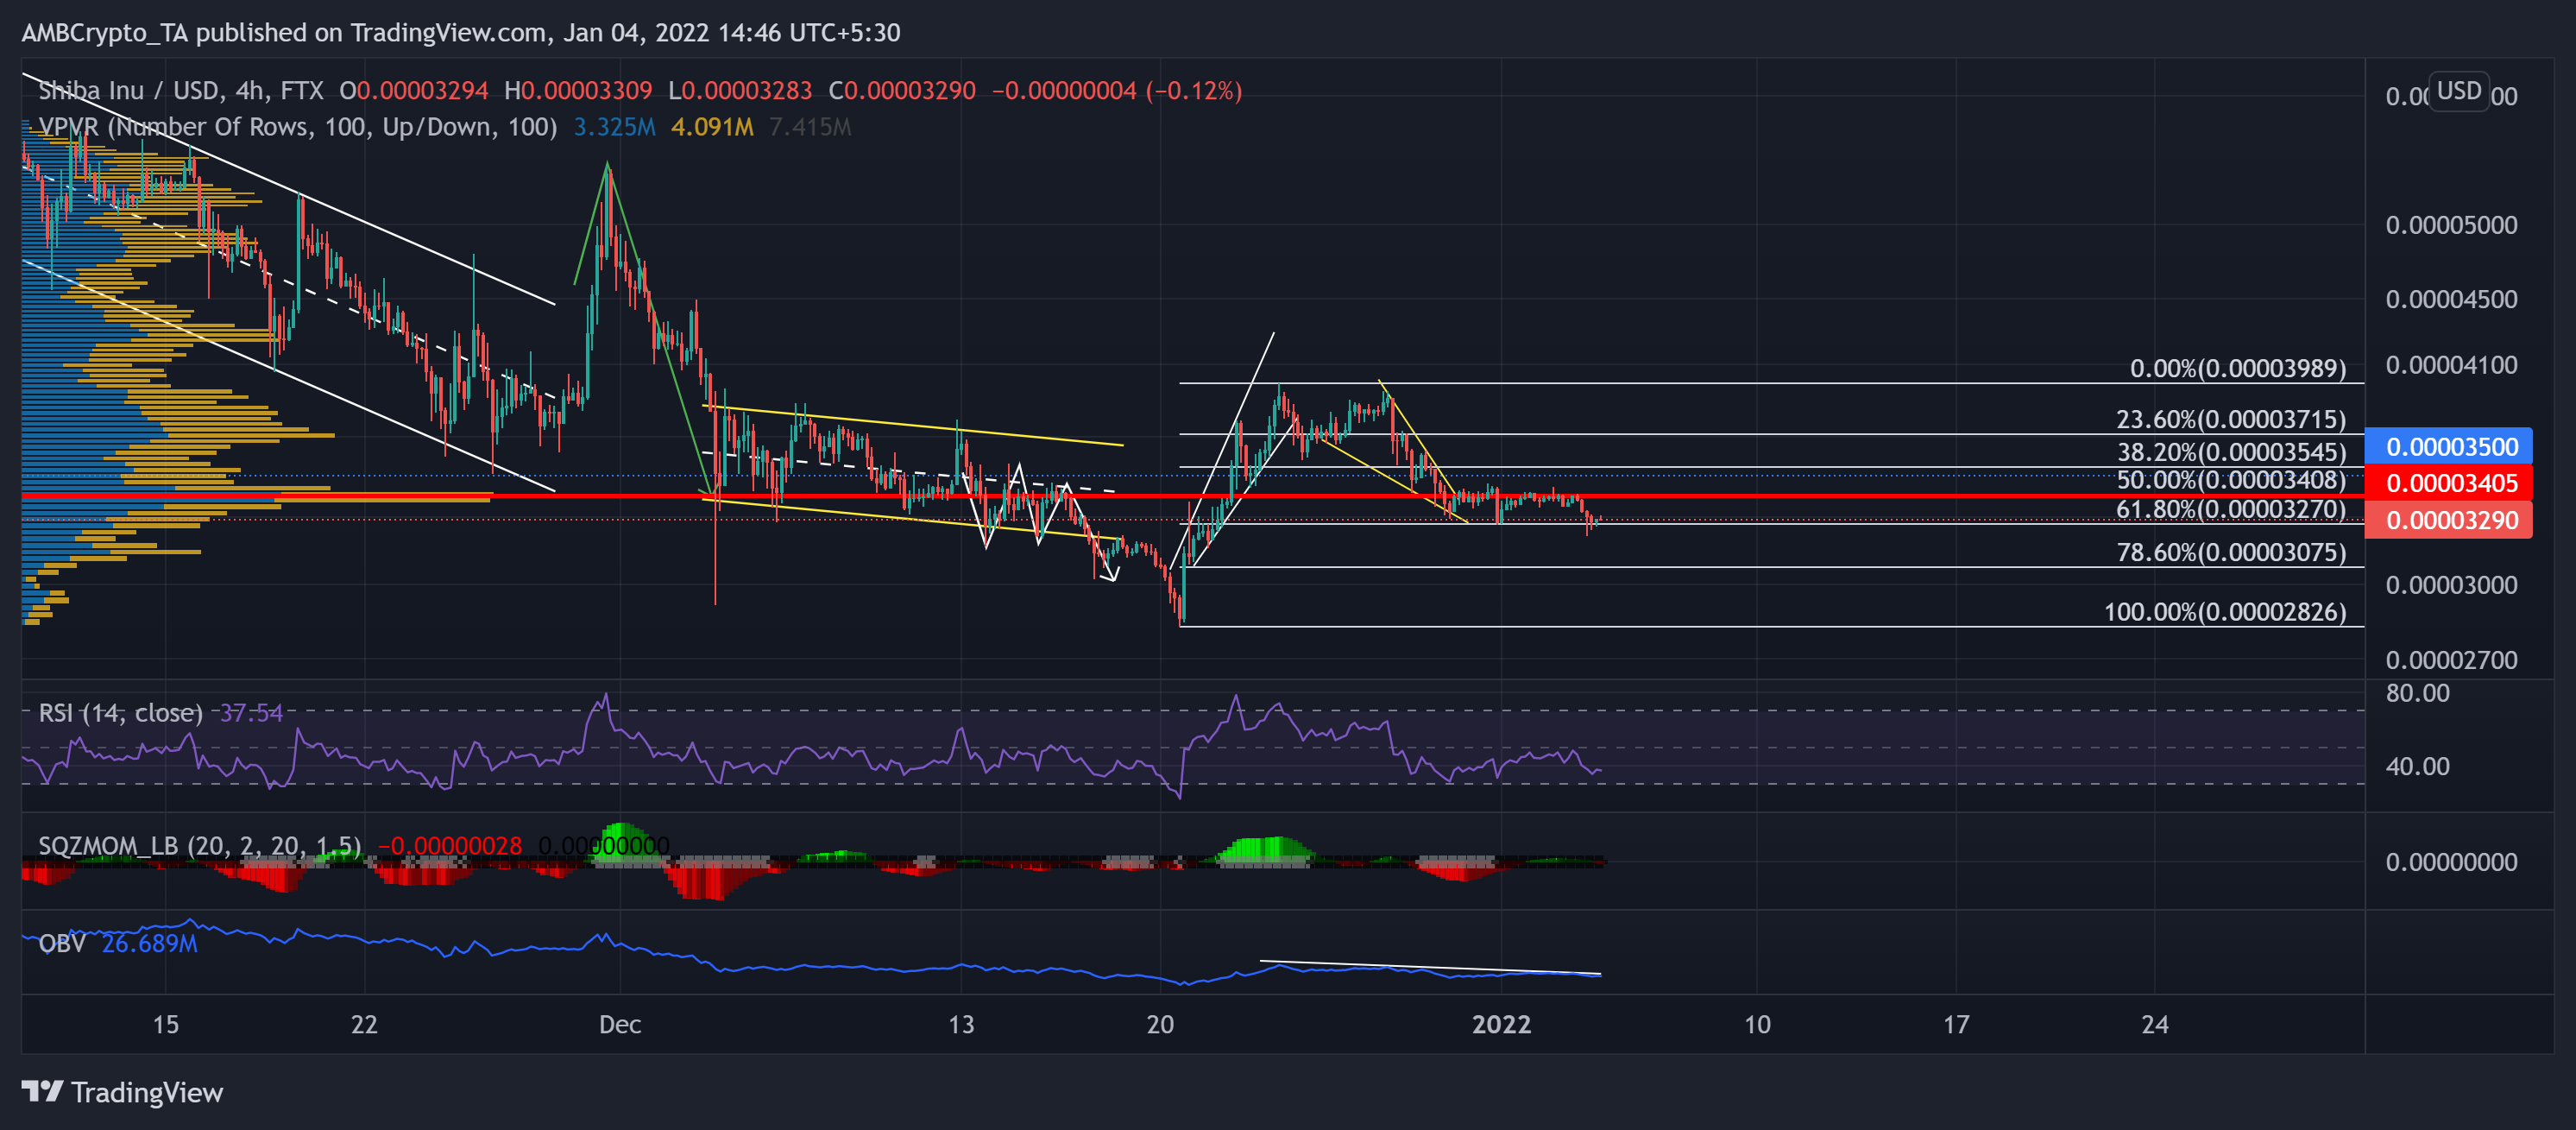
Over the past five days, SHIB oscillated between its Point of Control (red) and the 61.8% Fibonacci support. The recent falling wedge (yellow) breakout found it difficult to breach the $0.00003405-mark as the alt sought the highest liquidity near this area for nearly the past six months.
After a substantial 28 December sell-off, SHIB bulls flipped the vital $0.000035 nine-week support to its resistance. Now, as the 61.8% Fibonacci support stood strong, SHIB saw a green candle over the past few hours. Any further breakdown would find testing grounds at the 78.6% level.
At press time, SHIB traded at $0.0000329. The RSI swayed near the 37-mark and showed no revival signs at the time of writing. Also, the Squeeze Momentum indicator hinted at a low volatility phase. Further, the OBV was in descent and confirmed the decreasing buying pressure.
Algorand (ALGO)
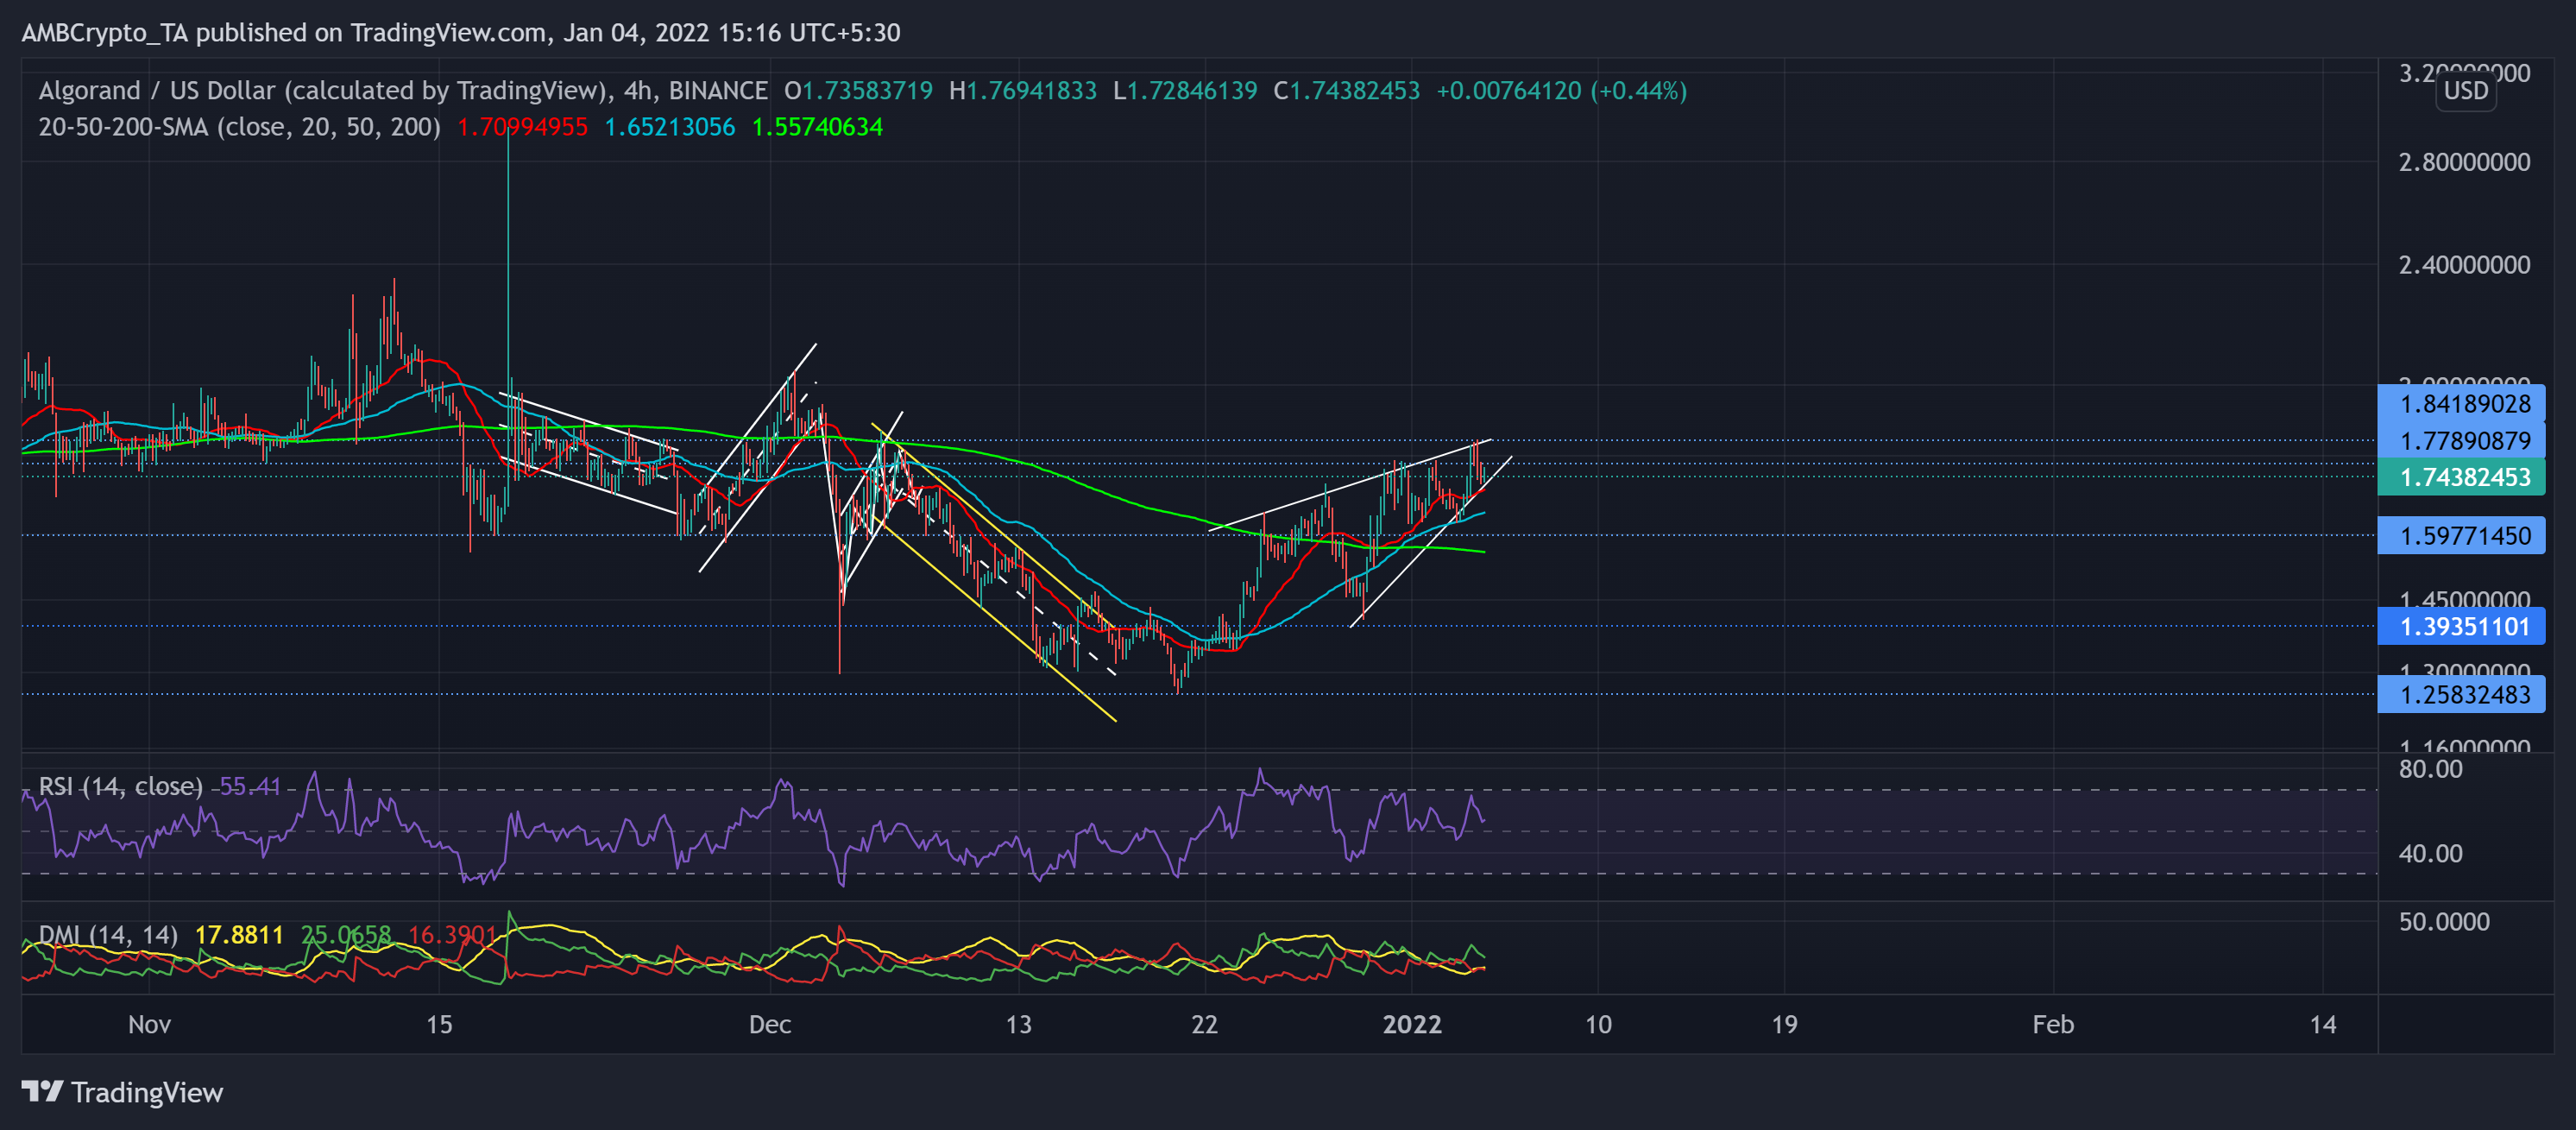
The altcoin saw an impressive 47.78% recovery (from the 20 December low) until it poked its one-month high on 3 January. Over the past ten days, ALGO formed a rising wedge (reversal pattern, white) on its 4-hour chart.
This incline reclaimed the $1.59-mark support while the $1.84 resistance still stood strong. The immediate testing point for the bears was at the 20-SMA (red) that coincided with the lower trendline of the wedge.
At press time, ALGO traded above its 20-50-200 SMA at $1.7438. The RSI stood at the 55-mark after choosing the bulls. Meanwhile, the DMI supported the bulls, but the ADX displayed a weak directional trend.
Decentraland (MANA)
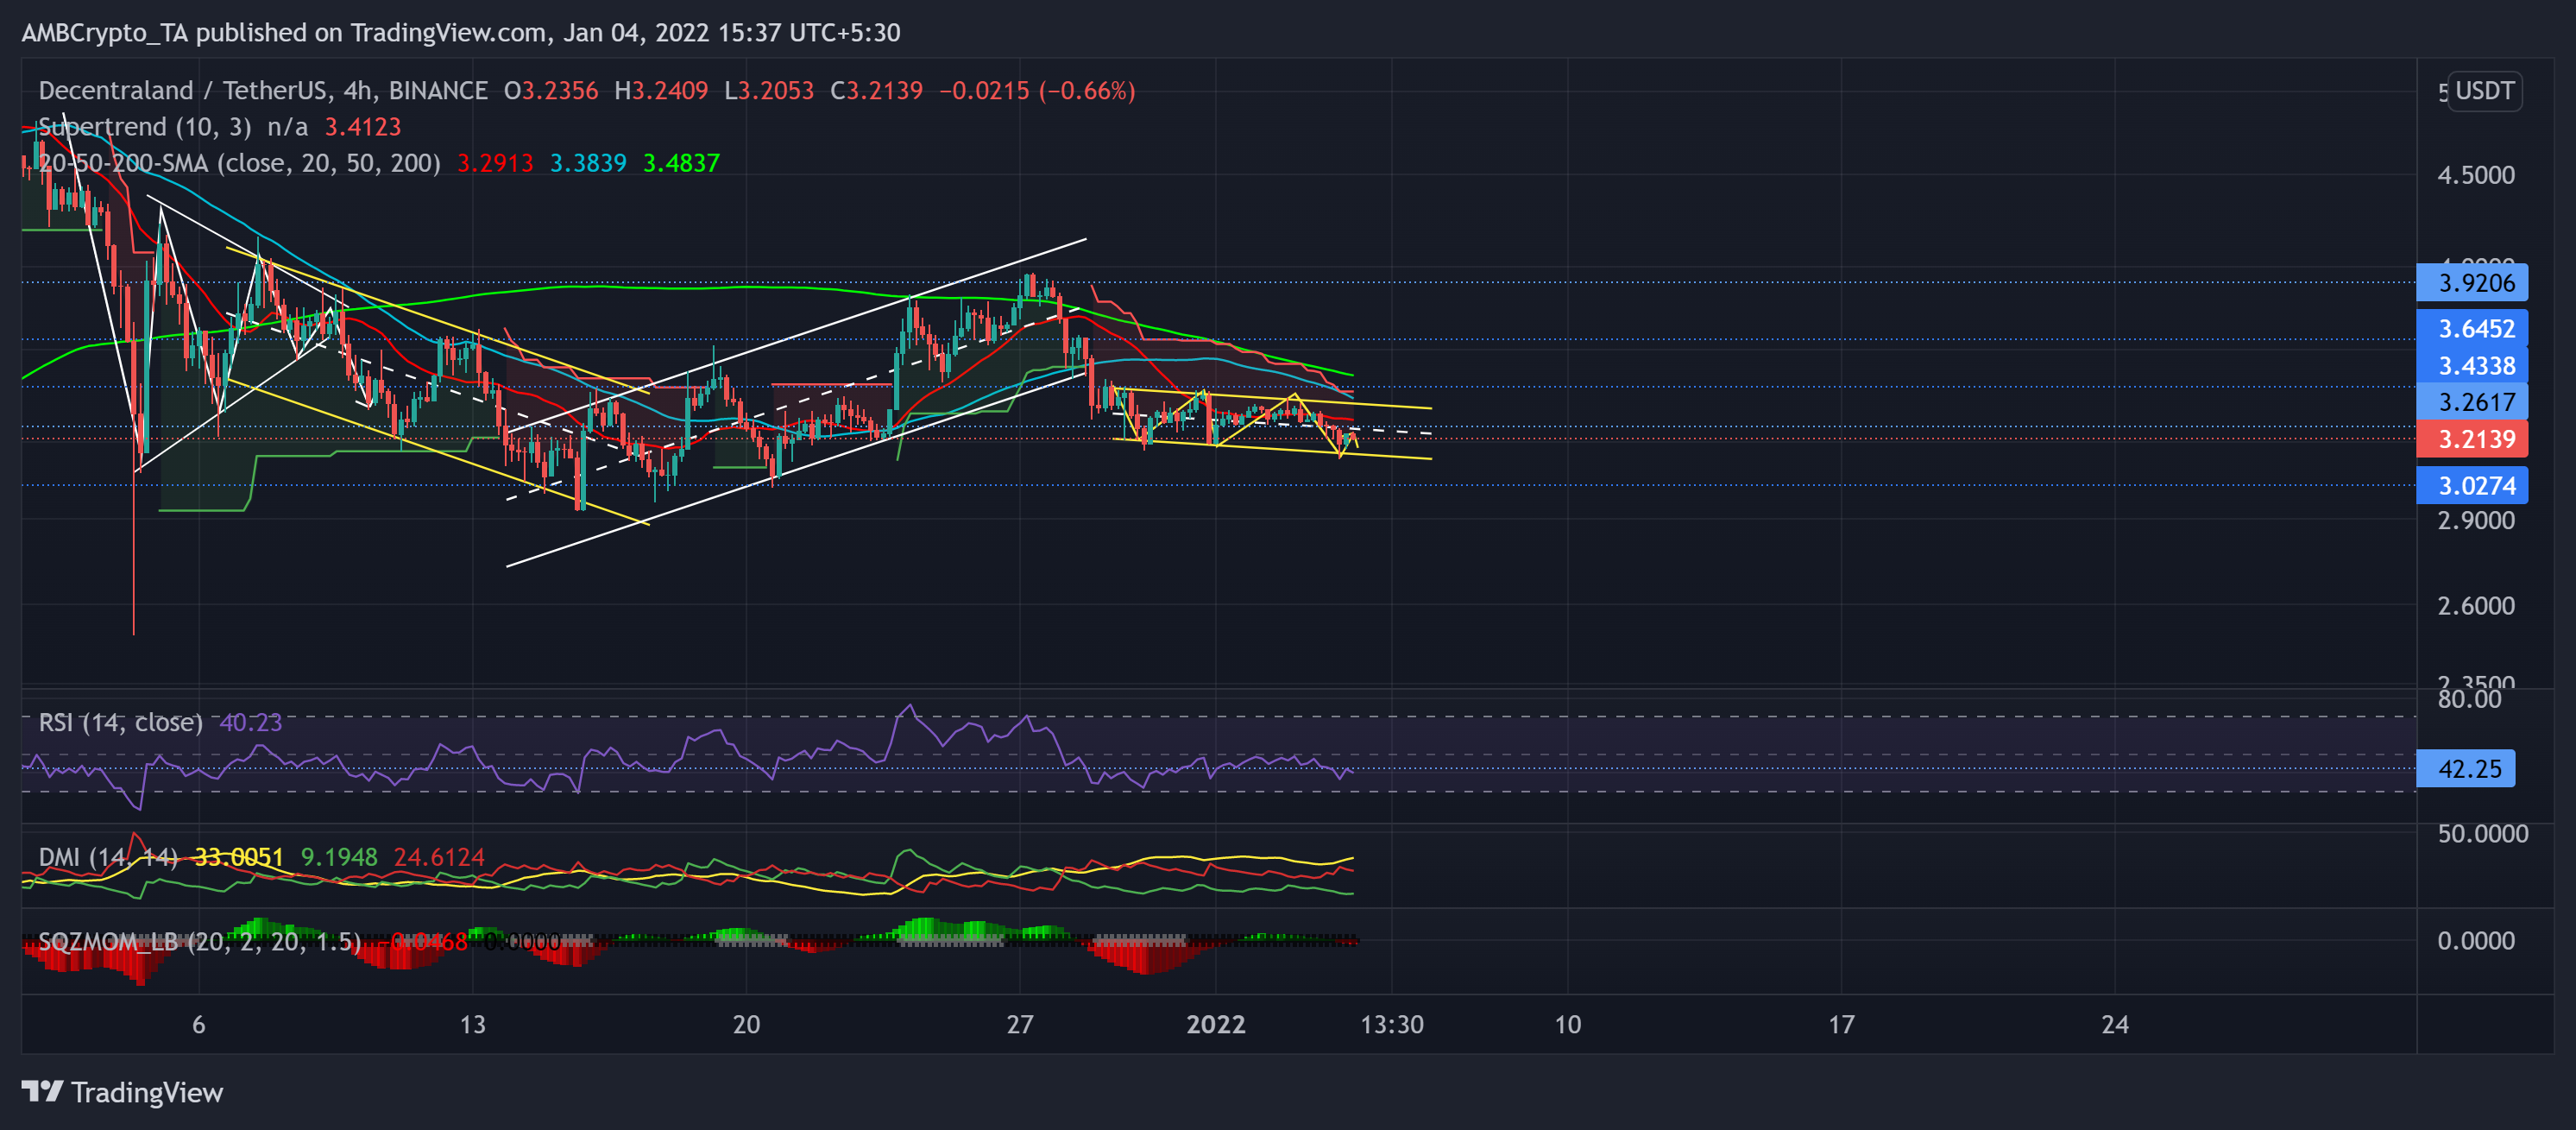
On its 4-hour chart, the alt marked a down-channel (yellow) over the past few days. It found an oscillating range between the $3.92 and $3.02-mark for the past month.
The alt marked a 19.09% retracement after poking its three-week high on 27 December. This fall pushed the price below its 20-50-200 SMA.
Now the immediate resistance was at $3.2-mark near the 20-SMA (red). Any close above this level would propel the bulls to test the upper trendline of the down-channel. Meanwhile, Supertrend displayed a sell signal.
At press time, MANA traded at $3.2139. The RSI fell below the midline and yet again found resistance at the 42-mark. Further, the DMI flashed a bearish preference. Nevertheless, the Squeeze Momentum indicated a low volatility phase.