Shiba Inu down nearly 40% in two weeks, but here’s what may be next

Disclaimer: The findings of the following analysis are the sole opinions of the writer and should not be considered investment advice
Bitcoin dropped below the $40.5k-level and saw a wick back up to $39k before some selling pressure over the past few days. This break of an important level for Bitcoin was followed by one of the more popular meme coins, Shiba Inu, dropping below an important support zone.
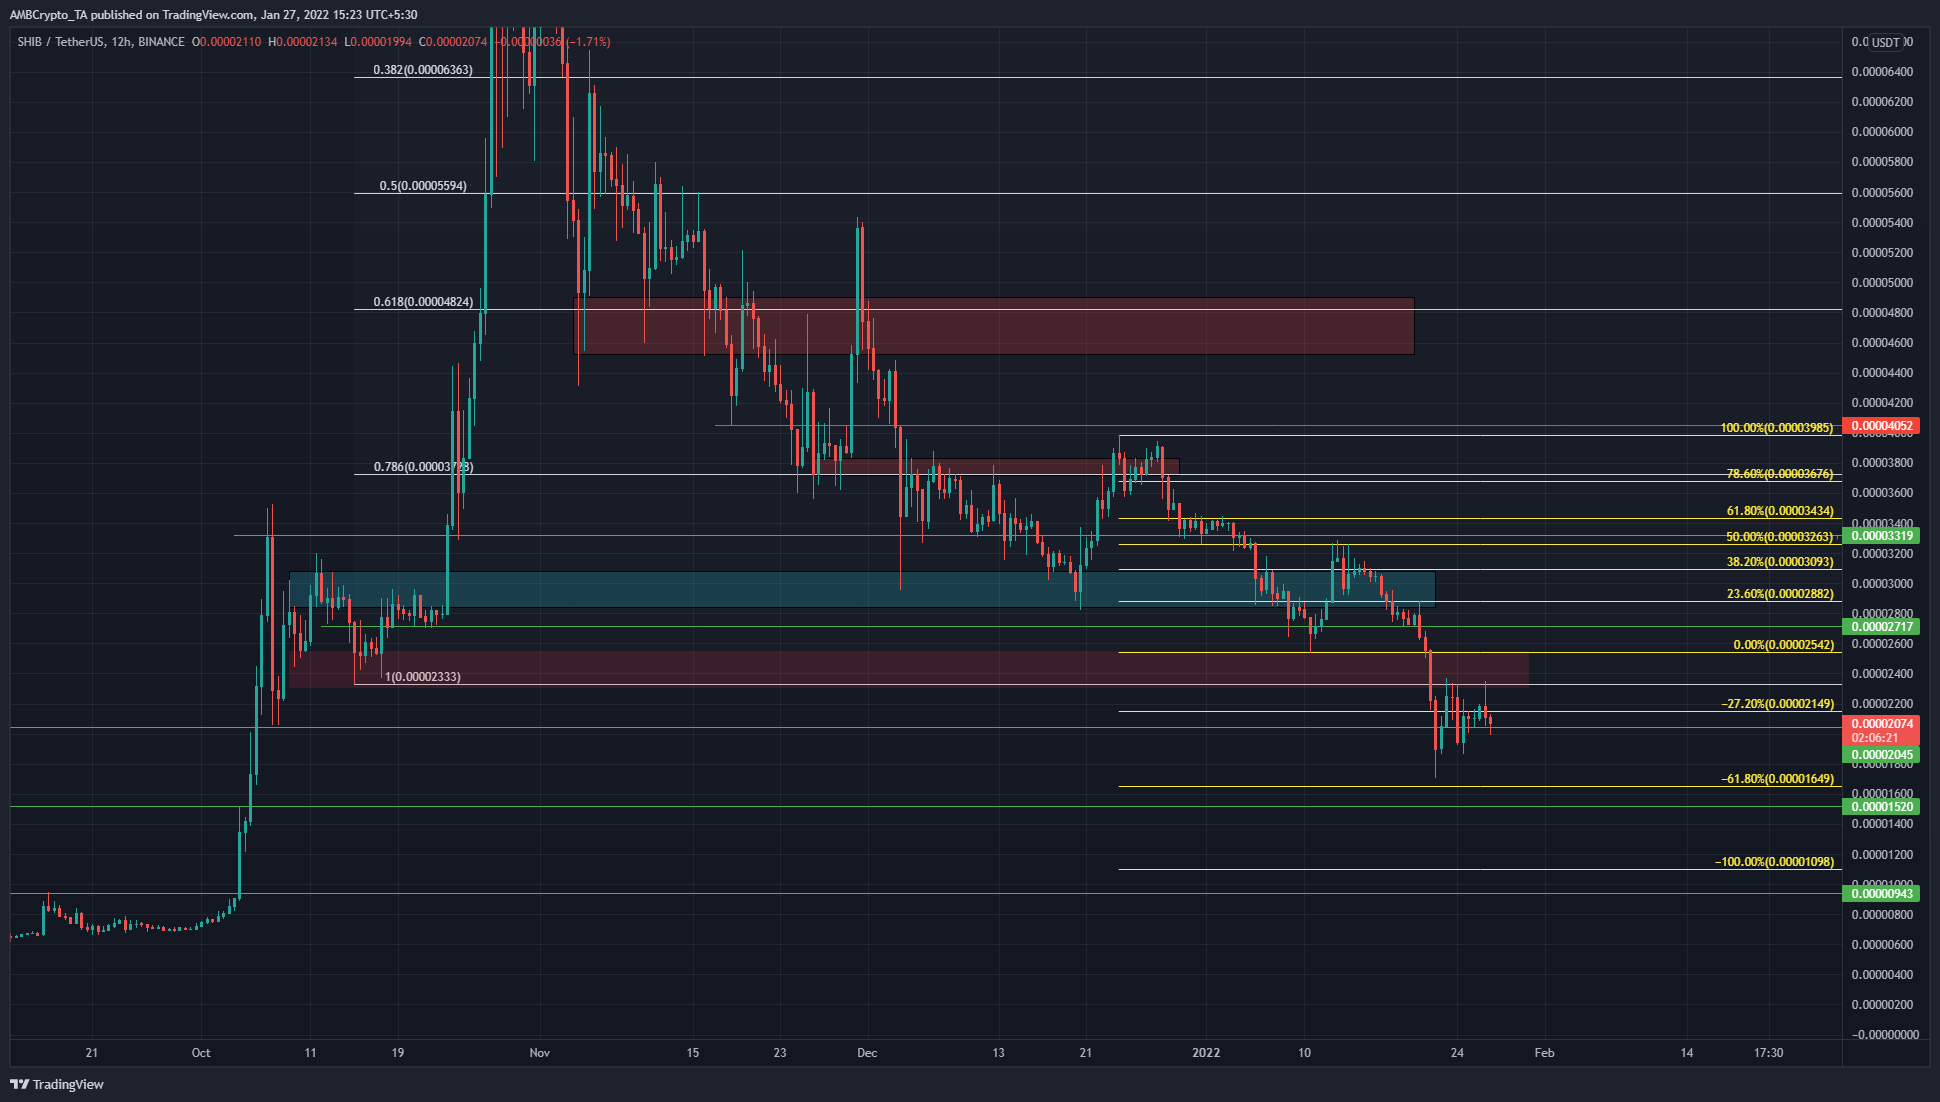
From that area, it has fallen by 37% based on the price at press time. The price always searches for liquidity, and for SHIB, this hunt for liquidity might see the price rise back to an area of supply before dropping once again.
Note that prices are expressed as 1000 times their current value for the sake of clear writing and fewer decimal places.

Source: SHIB/USDT on TradingView
Two sets of Fibonacci retracement levels have been plotted on the chart. The first, white one is based on SHIB’s move in October from $0.0233 to $0.0885. In November, SHIB slid below the 50% retracement level. The other set of retracement lines (yellow) are based on a more recent move from $0.0399 to $0.0254 in late December and early January. These levels have also been respected to some extent, making them levels we can watch out for.
At the time of writing, the price was below the 27.5% extension level for SHIB’s more recent move to the downside. The 27.5% and 61.8% extension levels are where the price can generally see some respite. However, SHIB did not see much demand.
The $0.024-area (red box) acted as demand in early October, but the price crashed right through in the recent sell-off event. This meant that large players could push the prices back to this area, tease a market structure break on lower timeframes before selling into the hands of eager buyers. Such a scenario would see SHIB crash heavily once again.
Rationale

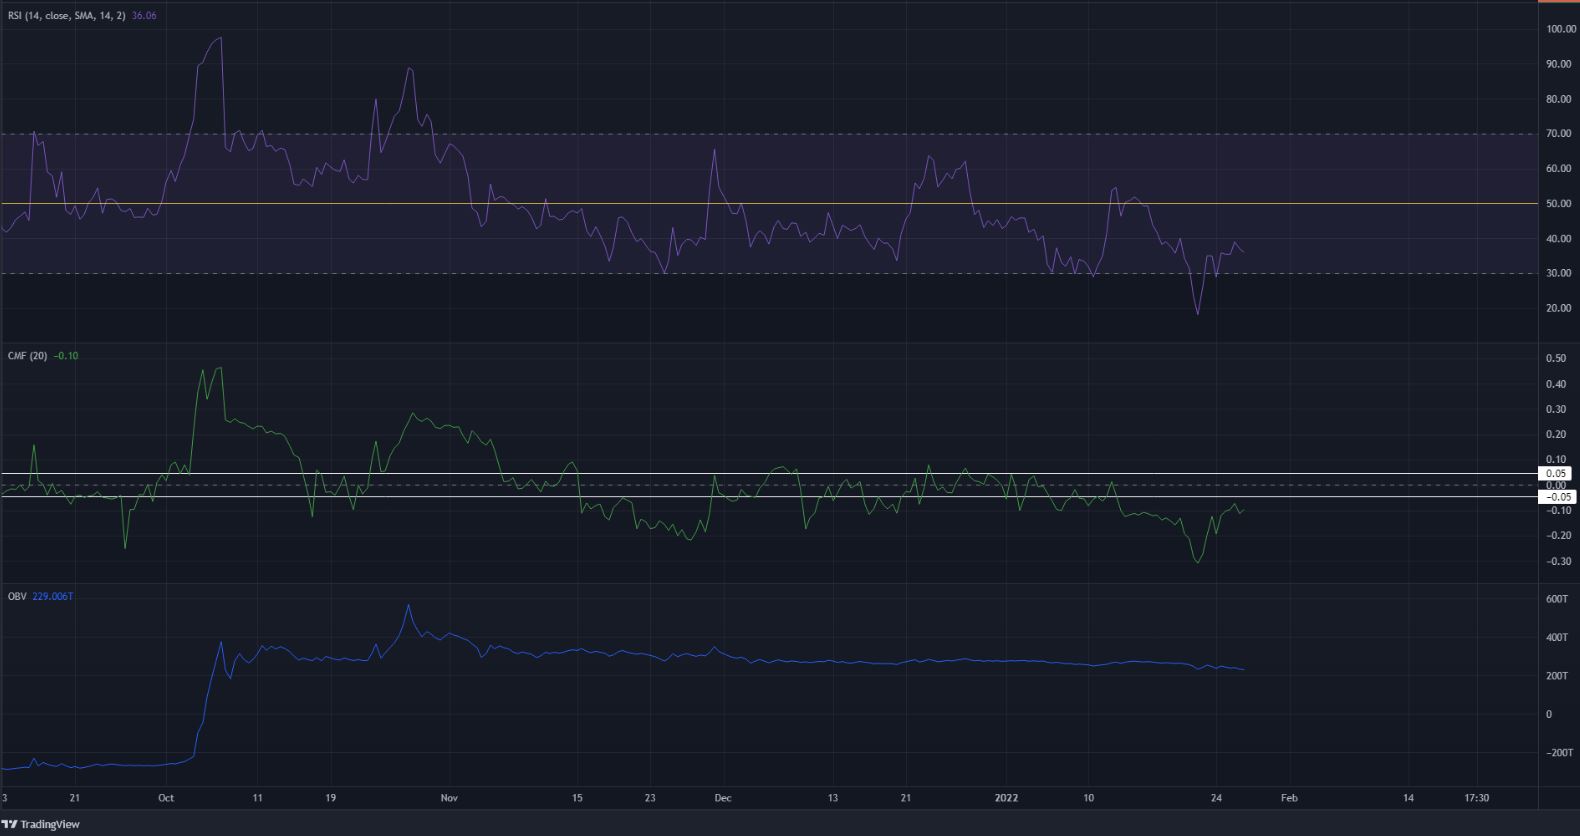
Source: SHIB/USDT on TradingView
On the 12-hour chart, the RSI has been below neutral 50 for a little more than a month. This showed a strong bearish trend. The CMF was also below -0.05, and the OBV was declining. Both these indicators showed that capital was indeed flowing out of the market.
A bounce in price to entice late buyers would provide more liquidity to large market participants, more so than a straight dump from the prices at press time. Hence, a rise to $0.024-$0.0252 would likely be selling and not a buying opportunity.
Conclusion
A bearish scenario has been laid out for SHIB. Bitcoin faces heavy resistance ahead, and neither BTC nor SHIB looked to be in any position to reverse their losses just yet. More downside could be the likely outcome in the weeks to come for SHIB.


