Shiba Inu: Going long on SHIB? All you need to know before placing near-term calls

Disclaimer: The findings of the following analysis are the sole opinions of the writer and should not be considered investment advice
After over three months, Shiba Inu [SHIB] found a bullish volatile break beyond the $0.0126-level. (For brevity, SHIB prices are multiplied by 1000 from here on).
However, the $0.017 ceiling put the meme coin back on a bearish track as SHIB fell below its four-hour 20/50/200 EMA. Now, as the price action approached its support zone, SHIB walked on thin ice.
Should the buyers defend the $0.01227-support, SHIB could see a rebound. At press time, SHIB traded at $0.01233, down by 7.42% in the last 24 hours.
SHIB 4-hour Chart
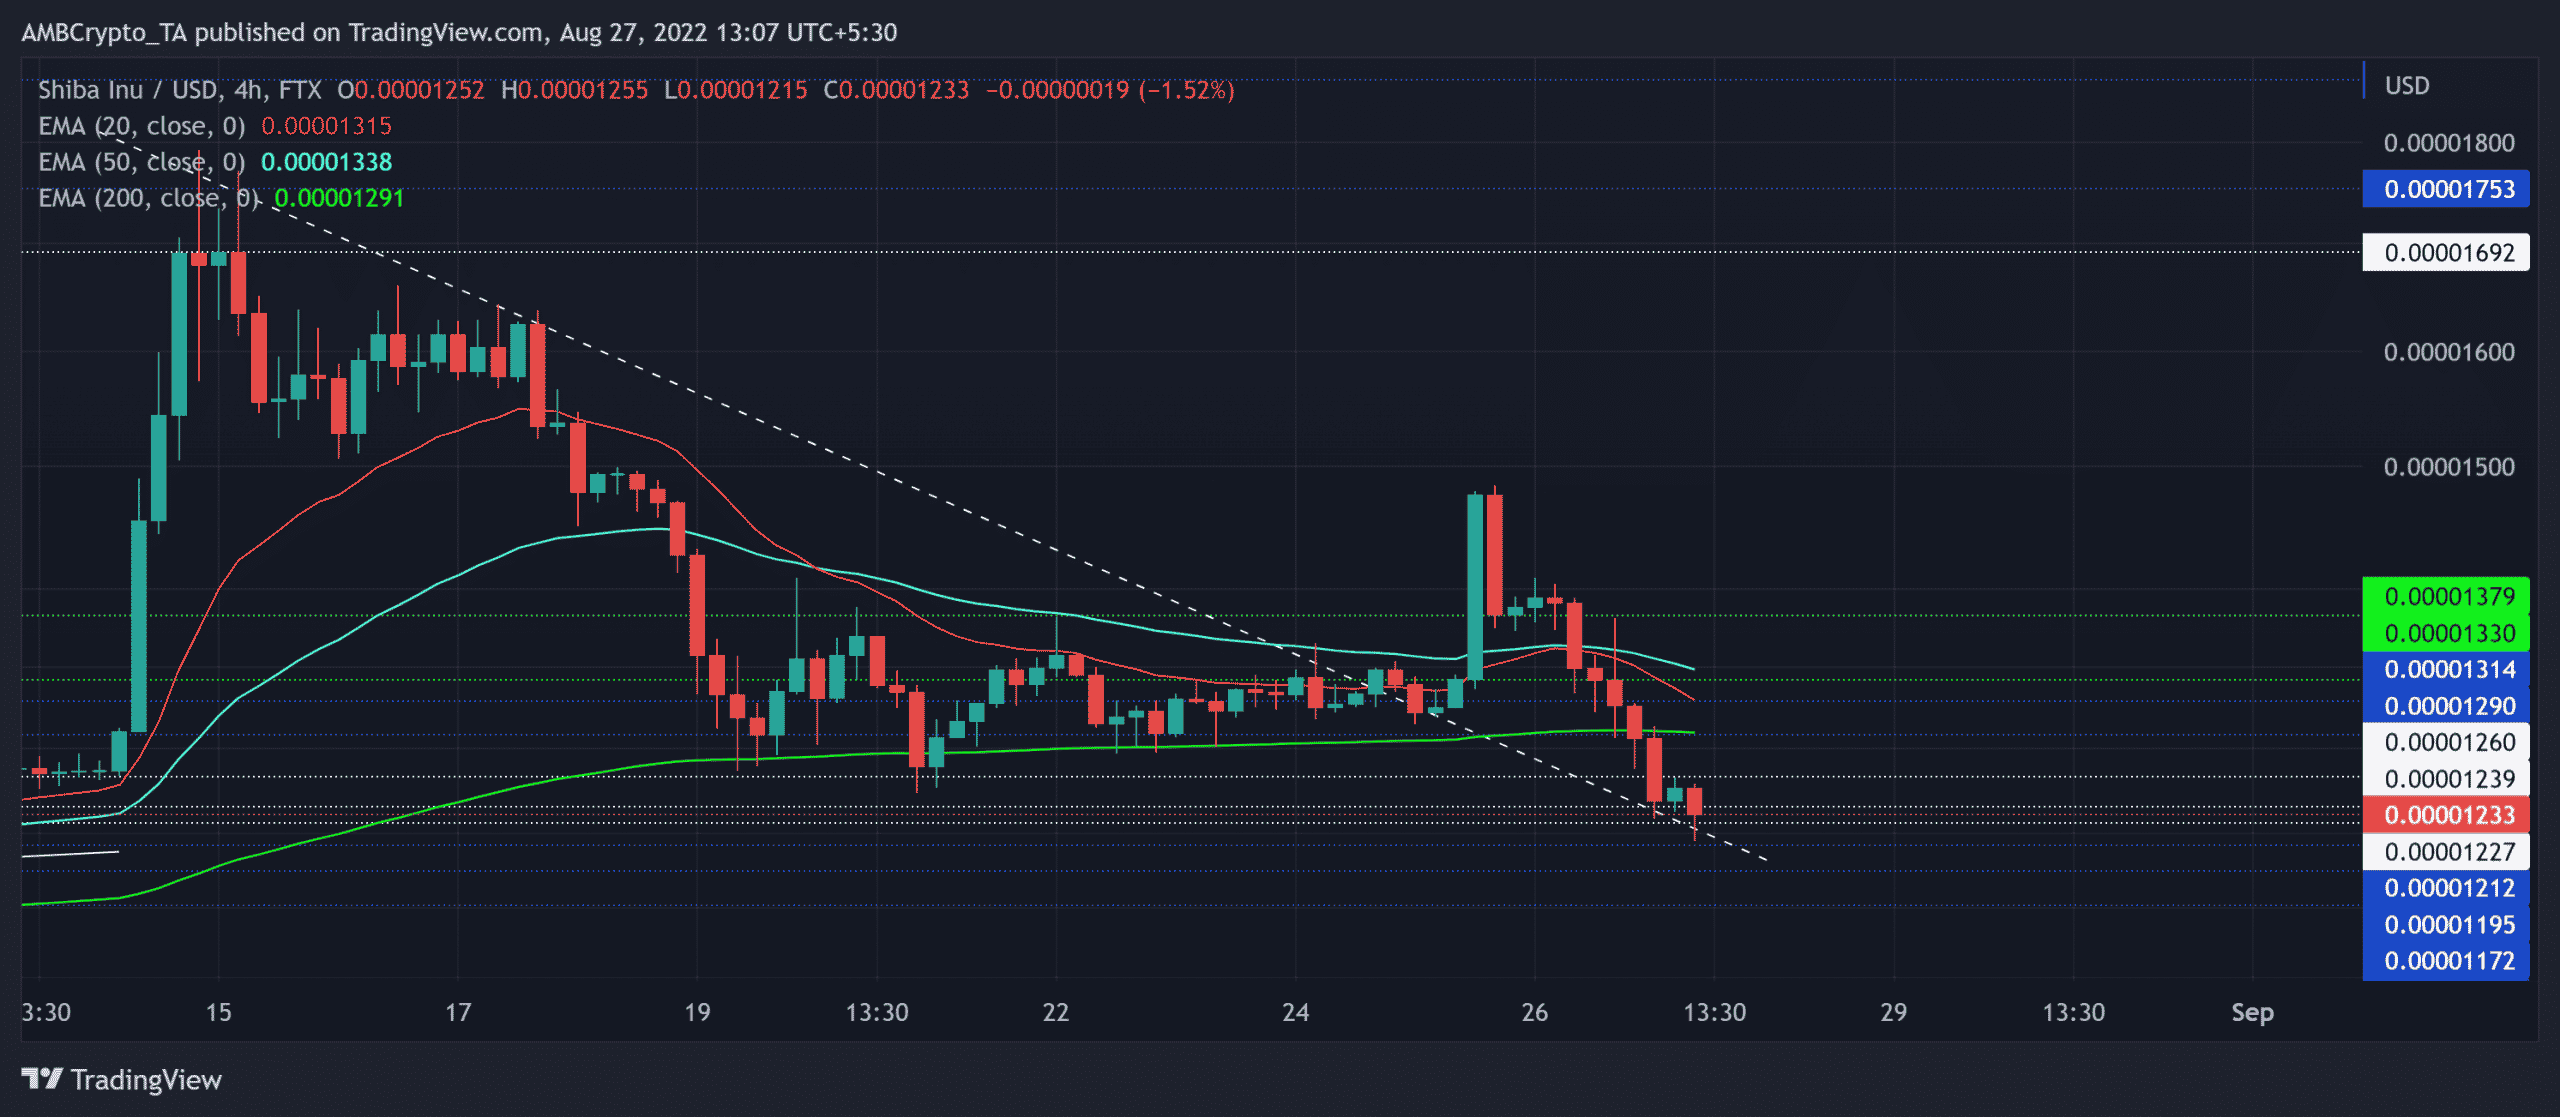
Over the last two weeks, SHIB’s descent entailed south-looking trendline support (white, dashed). The 25 August bullish engulfing candlestick flipped this trendline resistance to immediate support.
But the southbound 20 EMA (red) and the 50 EMA (cyan) refrained from a bullish crossover and resonated with the selling edge. Furthermore, the price action’s close below the 200 EMA (green) has reinforced the bearish vigor.
So, a decline below the $0.01227-level could extend the ongoing bearish move. In this case, the potential targets would lie in the $0.0117-$0.0112 range.
An immediate close above the $0.01227-mark can affirm reversal chances. In these circumstances, SHIB could witness a recovery toward its EMAs in the $0.0129-$0.0133 range. An inability to find a close above the two-week trendline support would encourage the bearish movements in the coming days.
Rationale
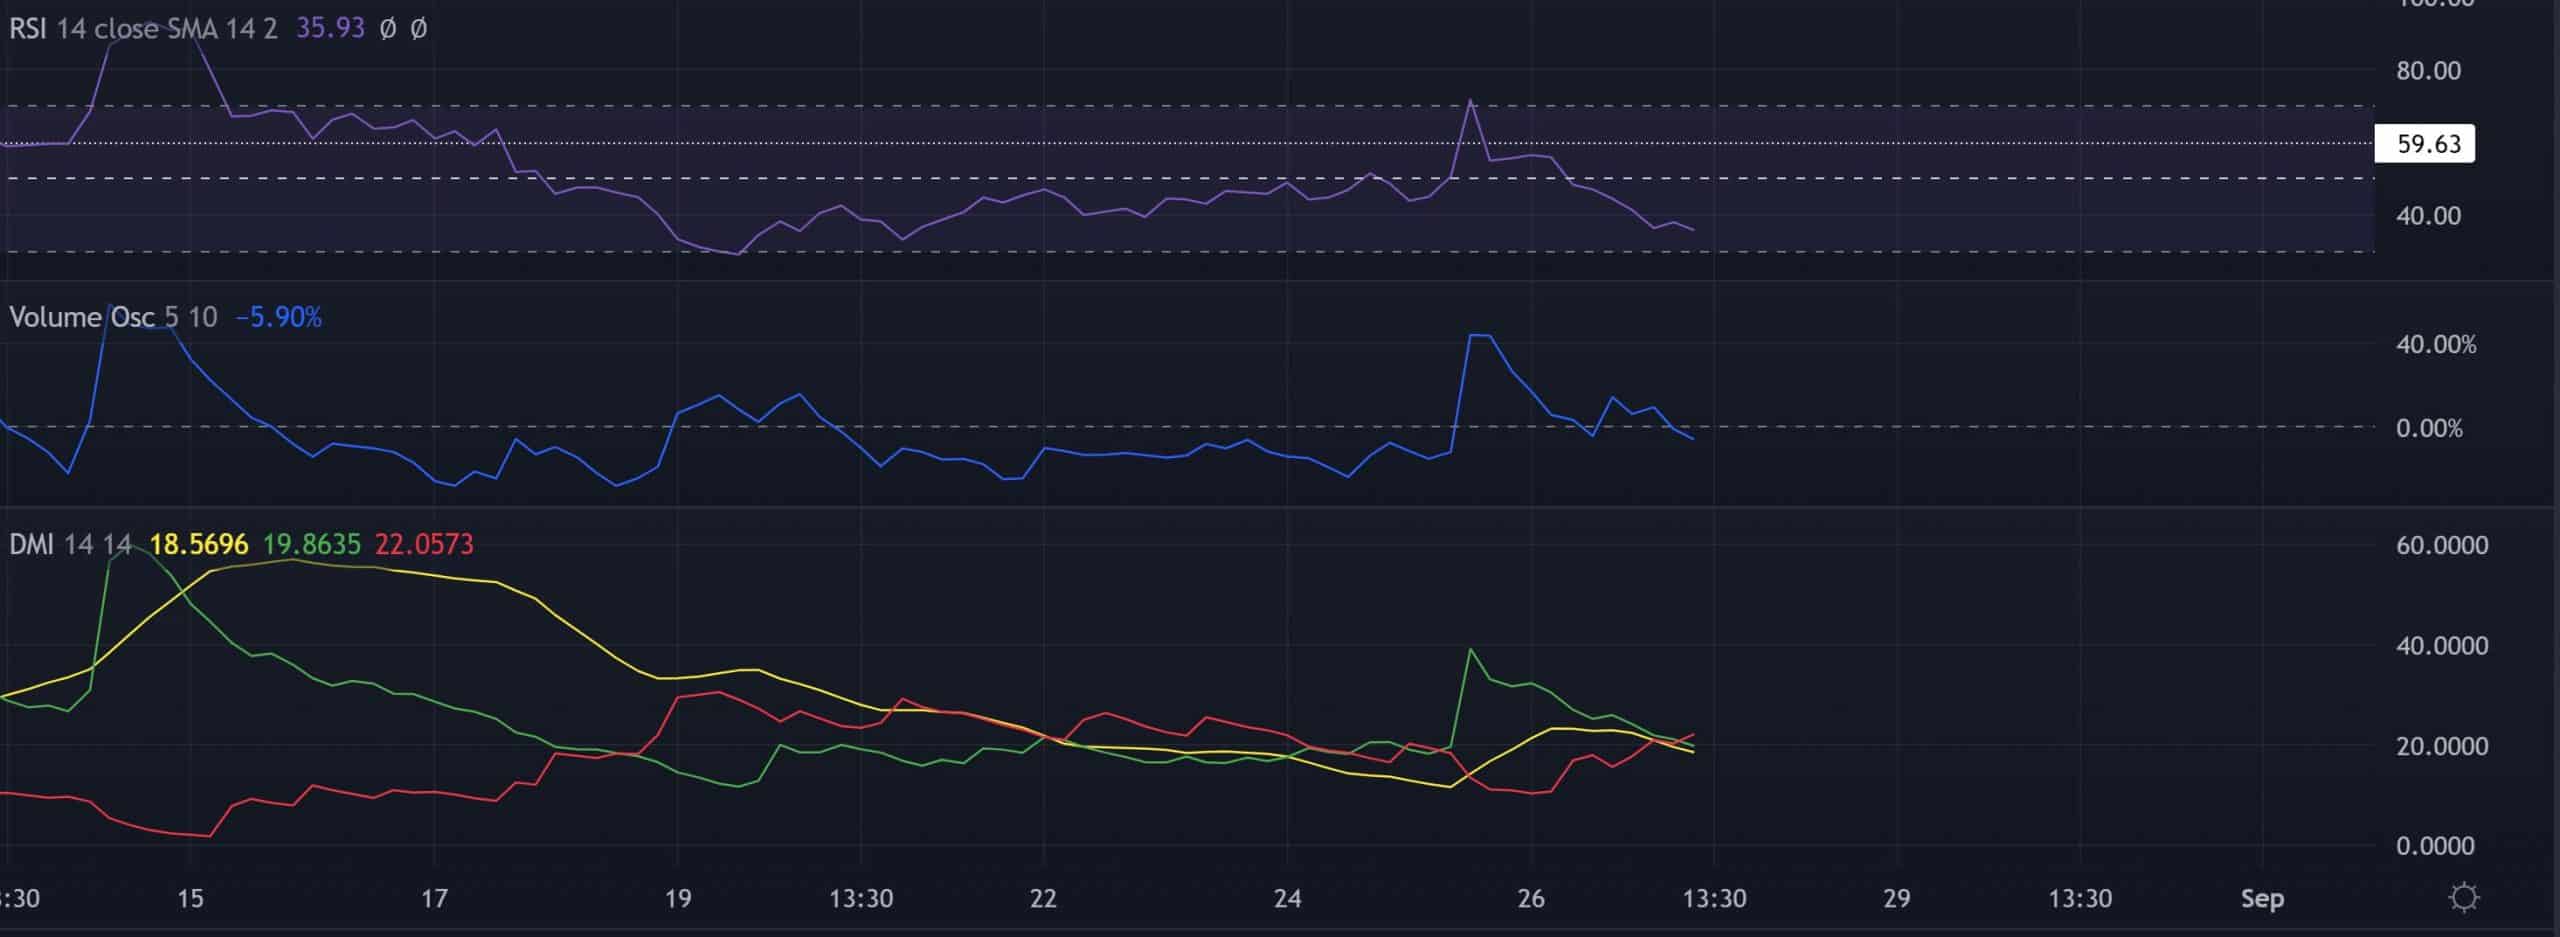
The Relative Strength Index (RSI) gradually moved south while eyeing to test the oversold region. Buyers should look for a potential rebound from this region before placing calls.
Nevertheless, the Volume Oscillator marked lower peaks and troughs during the current downtrend. This reading hinted at a relatively weak bearish move.
The Directional Movement Index (DMI) lines undertook a bearish crossover. But the Average Directional Movement Index (ADX) continued to depict a considerably weak directional trend.
Conclusion
Given the confluence of the $0.01227-baseline alongside the two-week trendline support, SHIB buyers would aim for a comeback. But the south-looking inclinations of the EMA could constrict the buying pressure to maintain a long-term bearish edge on this timeframe. The targets would remain the same as discussed.
Also, the alt shares a 14% 30-day correlation with Bitcoin. Thus, keeping an eye on Bitcoin’s movement with the overall market sentiment could be supplemental to identify any bullish invalidations.