Shiba Inu likely in an accumulation phase as it bounces within a range

On the daily chart, Shiba Inu continued to range between $0.027 and $0.037 (SHIB prices written as “current price x 1000” to use fewer decimal places). Trading volume was also low. Bitcoin rallied over the past week, and SHIB followed Bitcoin and it hauled itself off the $0.029 lows.
However, the market conditions for Shiba Inu shifted from a downtrend over November, into one of possible accumulation in December. An event could hype SHIB once more (perhaps a Musk tweet) and would likely be the catalyst of a breakout.
SHIB — 1-day chart
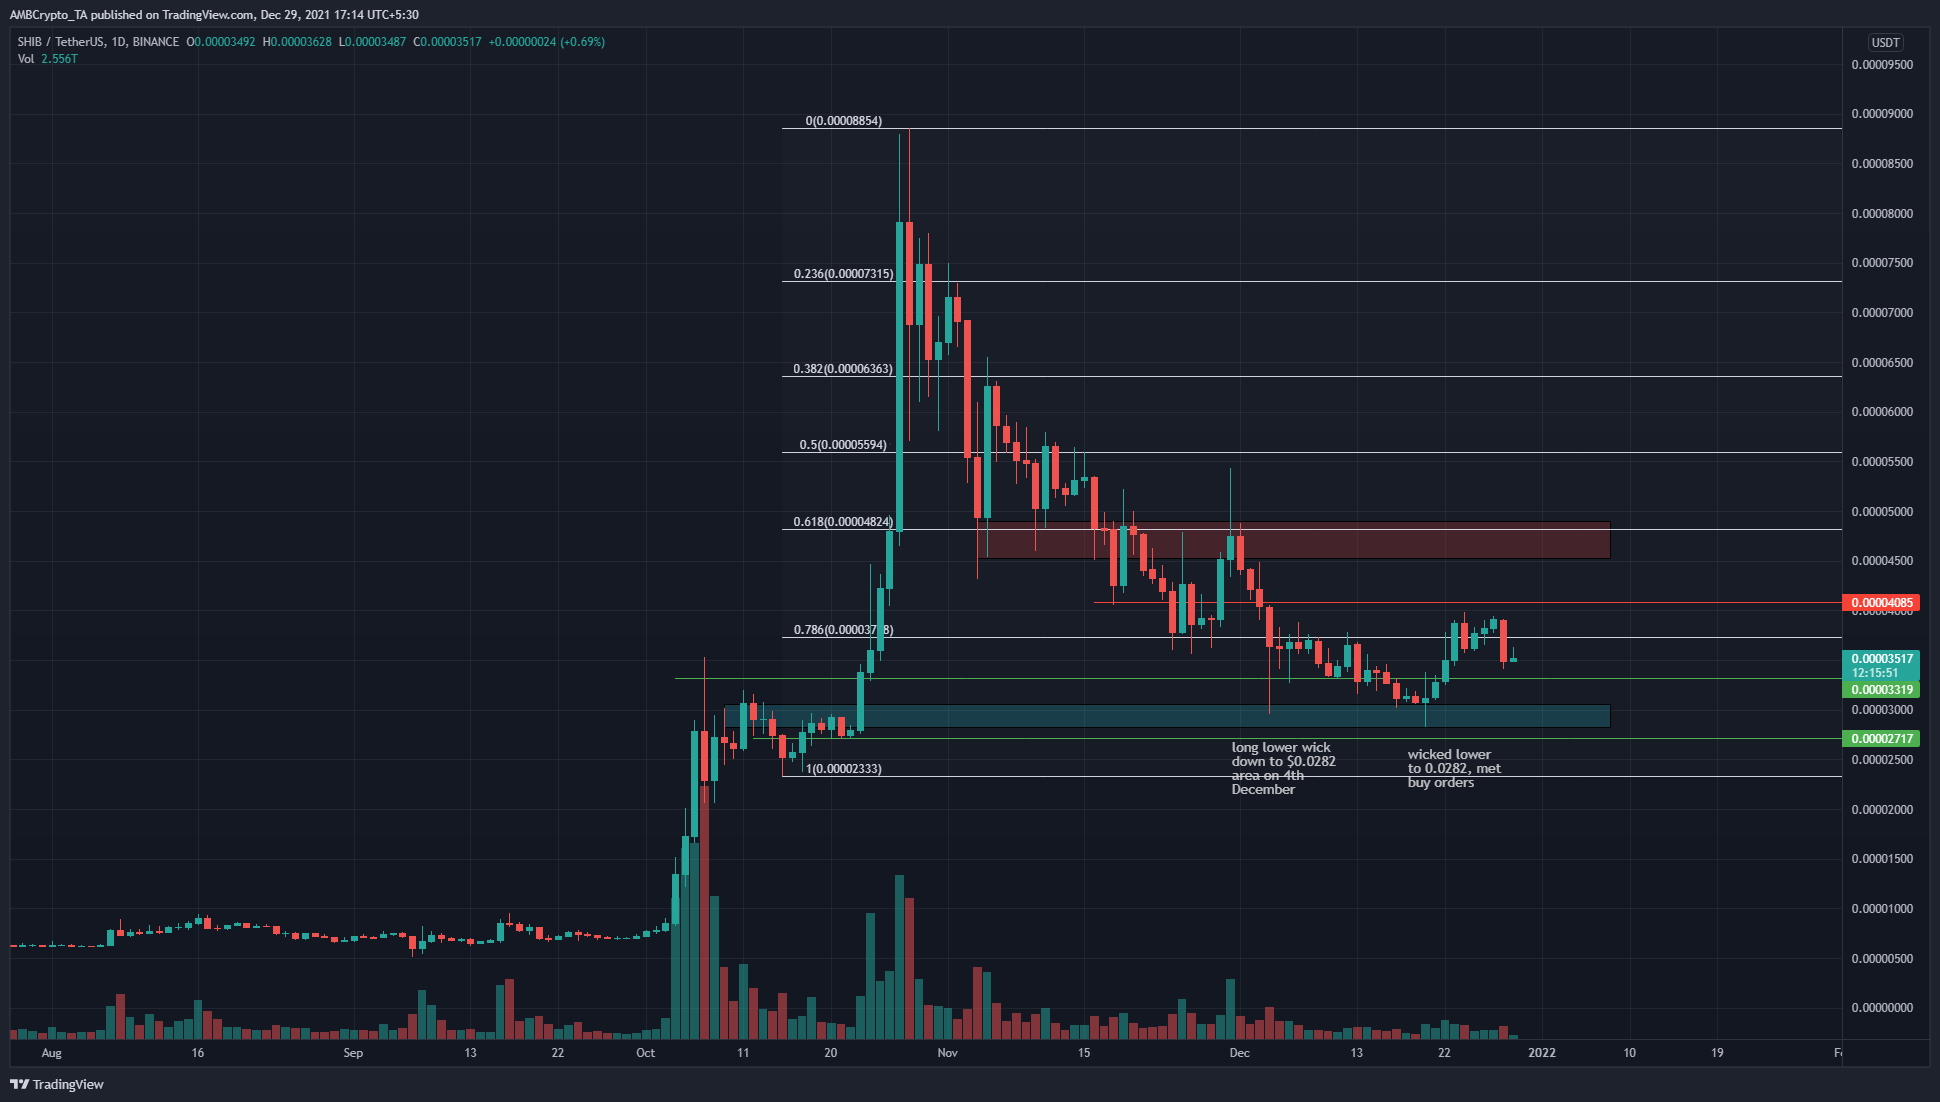
The $0.029 area (cyan box) had been a place where SHIB found sellers in its late September/early October rally. SHIB pulled back to $0.023 and then rocketed upward for the rest of the month of October (“Uptober” for both SHIB and the rest of the crypto market).
The Fibonacci retracement levels plotted for the move from $0.023 lows to $0.088 highs, showed that SHIB was unable to stay above the 78.6% retracement level at $0.037. A daily candle did close above this level a few times in the past week, but SHIB was swiftly banished to lower levels.
Shiba Inu doesn’t really have fundamentals to speak of, nor any technical development news that could temporarily spur the market in either direction. For the most part, it trends alongside Bitcoin. Like Dogecoin, SHIB too has its moments when it consumes the market and sees tens of billions of dollars worth of trading volume a day.
Well, it’s worth noting that a risk-loving investor would look toward the $0.027-$0.03 area to accumulate SHIB.
Rationale
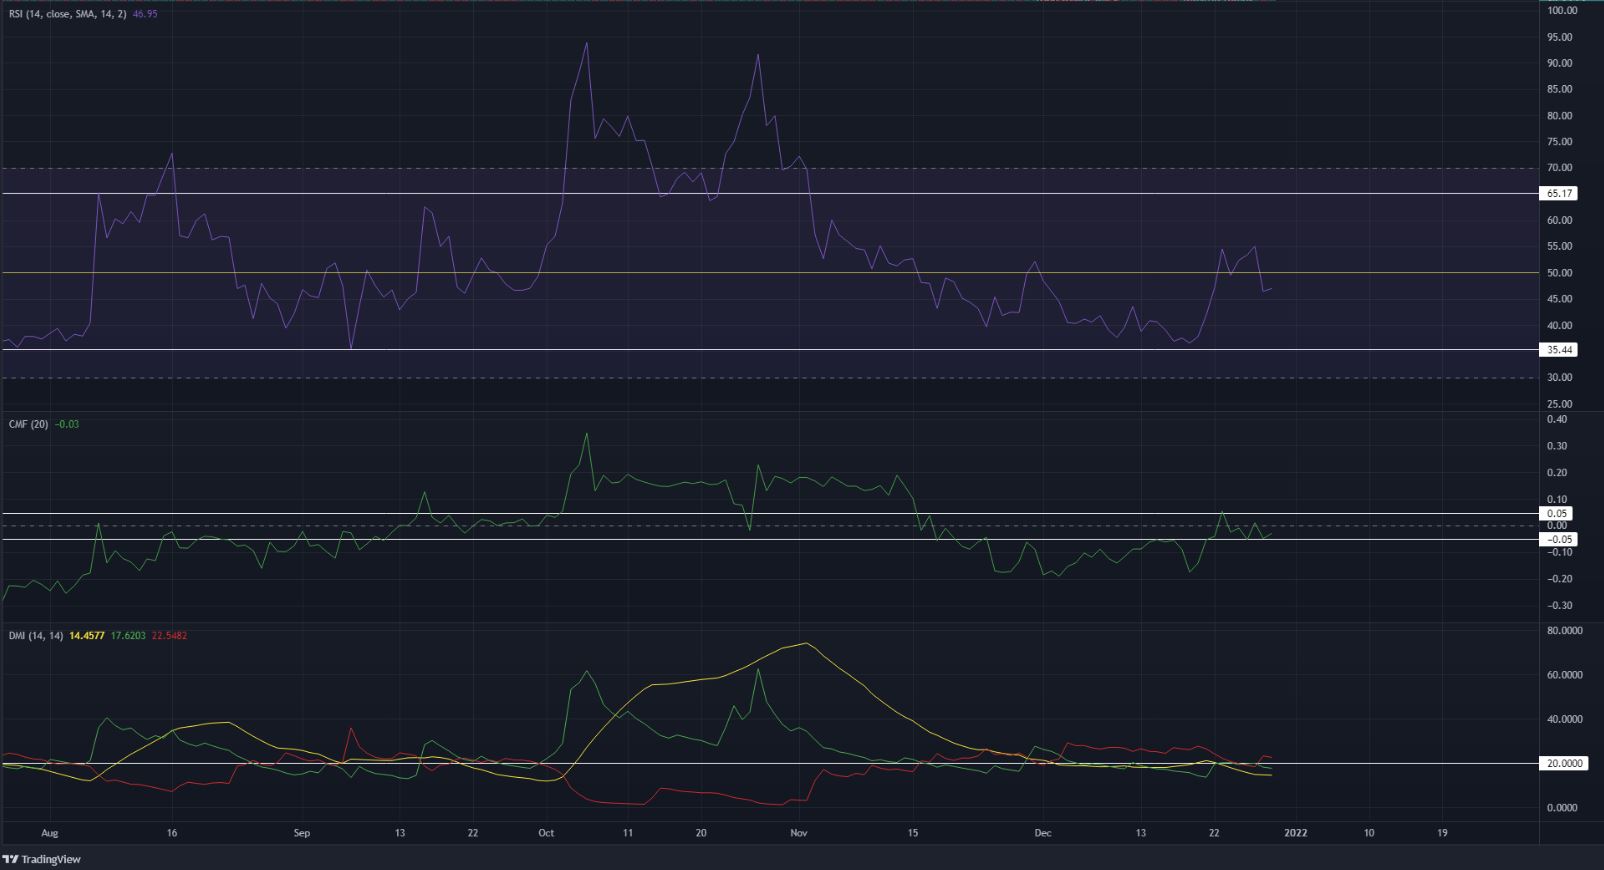
The RSI was moving about neutral 50 and did not indicate a strong momentum in either direction yet. It did not do beneath the 35.44 level, which remained something of a doomsday level on the daily RSI. Similarly, the 65.17 level was untouched, and it can be regarded as a “To the moon!” level too.
The CMF was between +0.05 and -0.05 and showed capital flow was headed out of the market but rather weakly. The Directional Movement Index’s ADX line (yellow) was below 20 which showed a lack of a definite trend.
Conclusion
Sideways trading on a long time horizon appeared likely for Shiba Inu. Shorter time frame trade opportunities would certainly arise, but unless the $0.037 is flipped to support, a trader/investor would likely look to buy SHIB in the $0.03 area on the chart.


