Shiba Inu: Measuring the true potential of still HODLing SHIB

Disclaimer: The findings of the following analysis are the sole opinions of the writer and should not be considered investment advice
The dog-themed meme token has been on a swift decline since its ATH last year. Shiba Inu (SHIB) fell between a southbound parallel channel for months until the bulls stepped in to defend the $0.02-mark. (SHIB prices are multiplied by 1000 from here on).
Given the recently extended squeeze phase, SHIB would continue its movement near its Point Of Control (POC, red) before entering a high volatility phase. The alt needs to topple its first barrier at its immediate trendline resistance to open up recovery gates towards the $0.025-mark.
At press time, SHIB was trading at $0.02325, down by over 2% in the last 24 hours.
SHIB Daily Chart
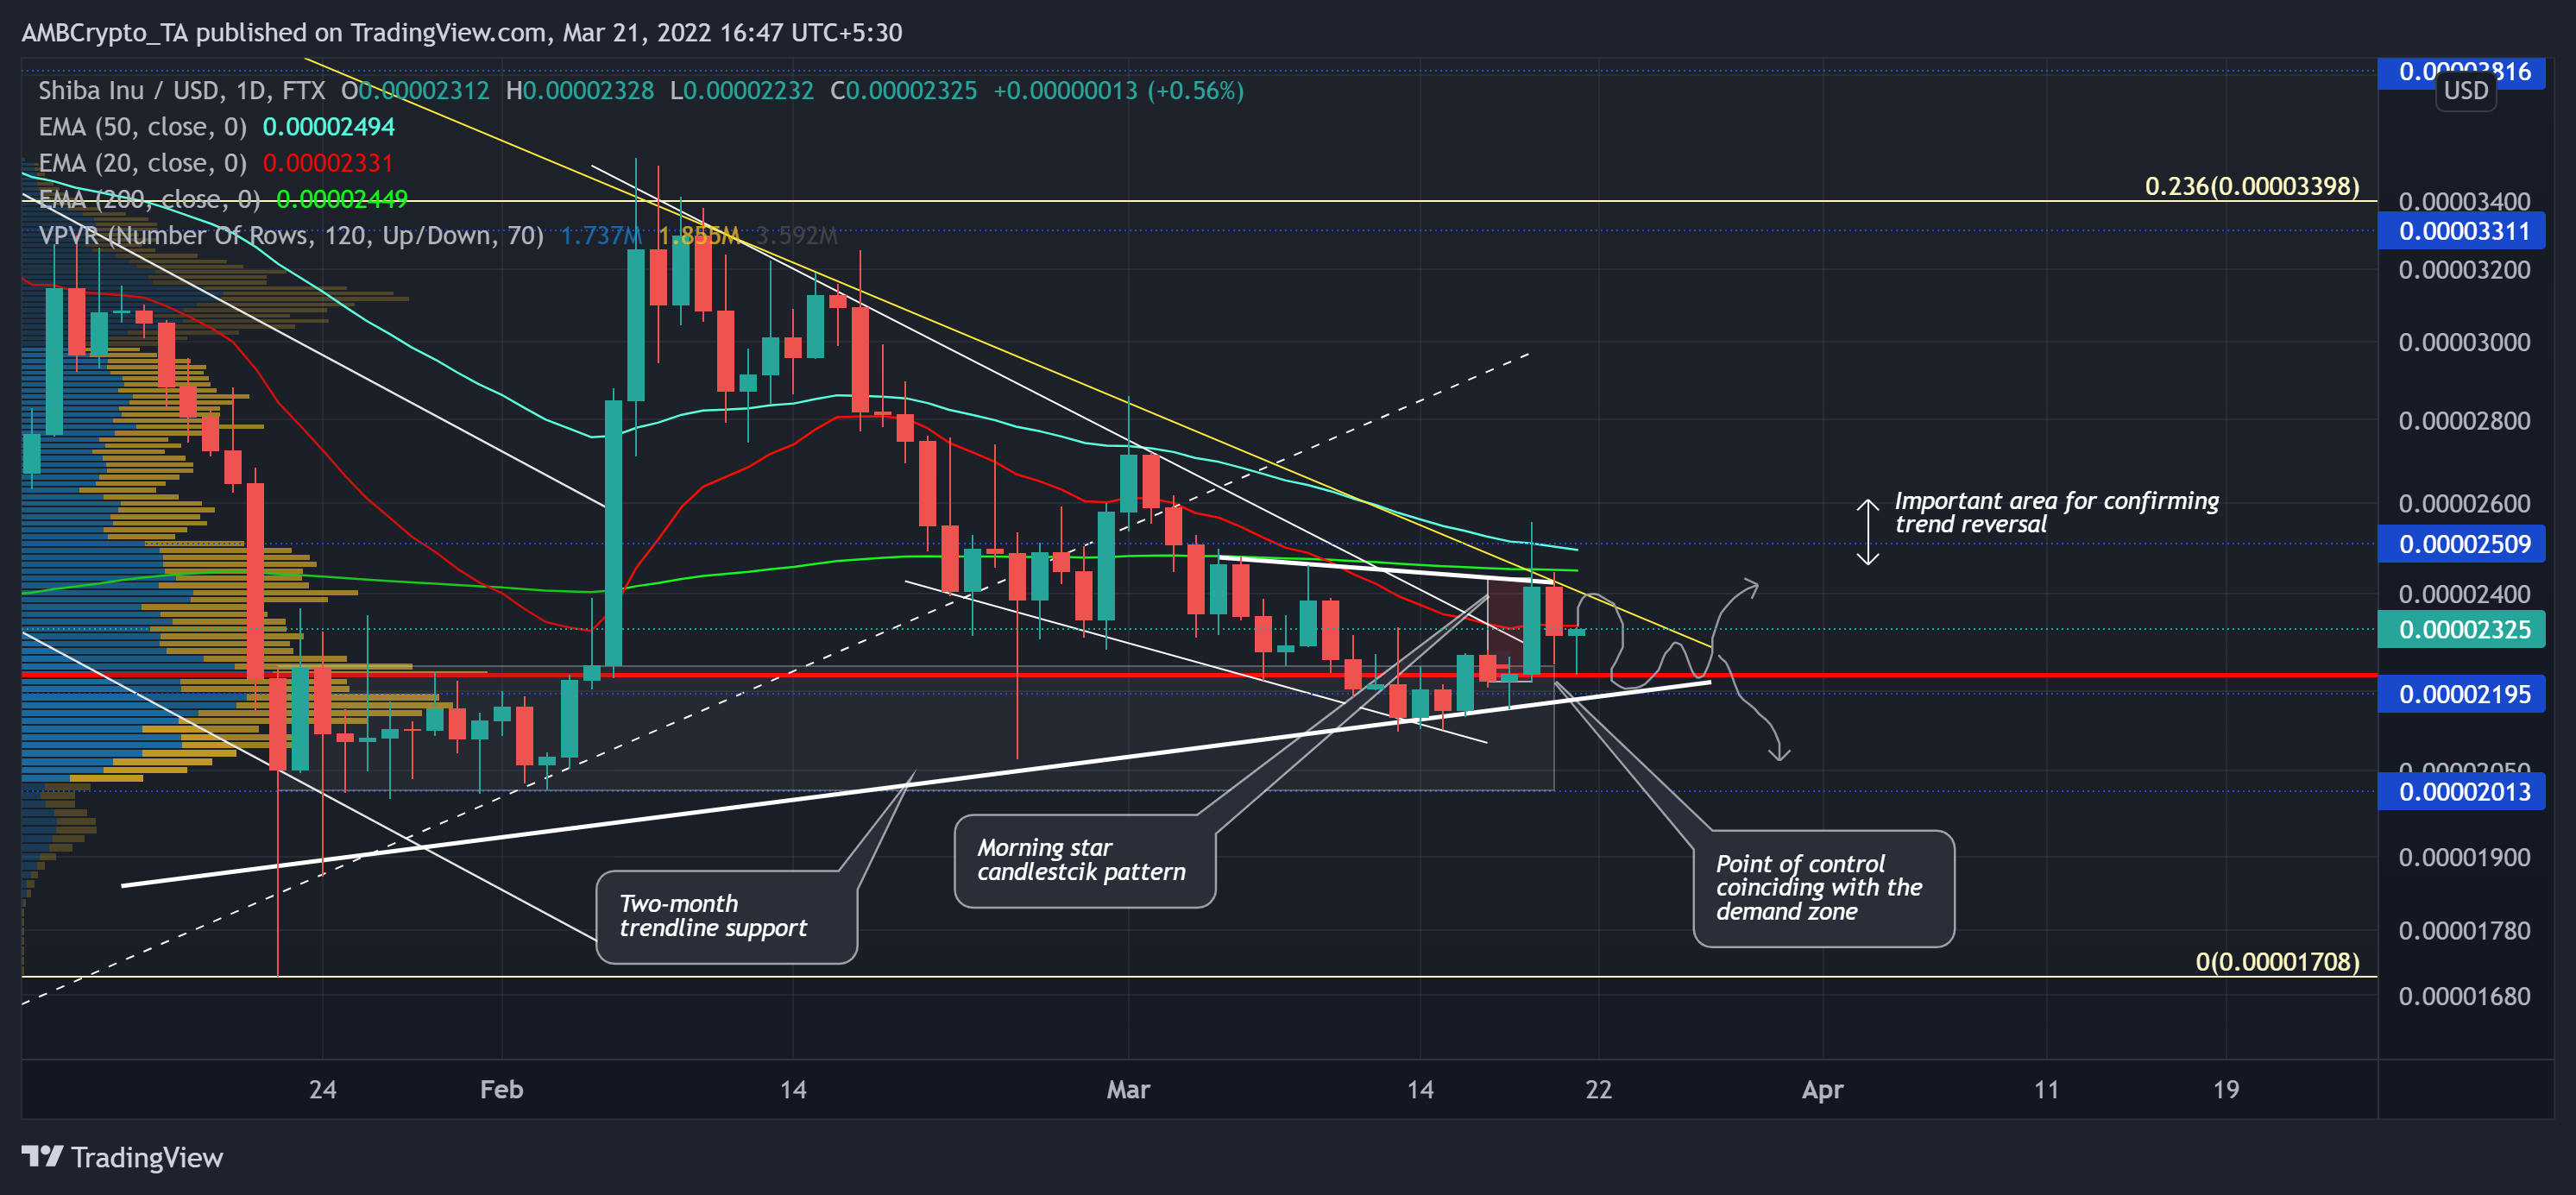
During the phase, SHIB lost its liquidity range (POC) near the $0.022-level while falling below its 20/50/200 EMA. The bulls took charge of the $0.02-mark that they upheld for over four months. As a result, SHIB saw a recovery that halted at the 23.6% Fibonacci resistance.
Following the same, buyers were on the back foot while the bears took control of the peaks until they flipped the $0.025-mark from support to resistance. Now, the price has entered a tight phase while the bulls have started building up pressure and rejecting the lower prices. Over the last month, SHIB formed a falling wedge (reversal pattern) on its daily chart. But, as the 20 EMA plunged below the 200 EMA (green), the bears visibly maintained their edge.
Considering the tendency of the SHIB bulls to defend the two-month trendline support, the alt could see a near-term recovery before a pullback. Any close above the trendline resistance (yellow) could wnable a test of the $0.023-resistance.
Rationale
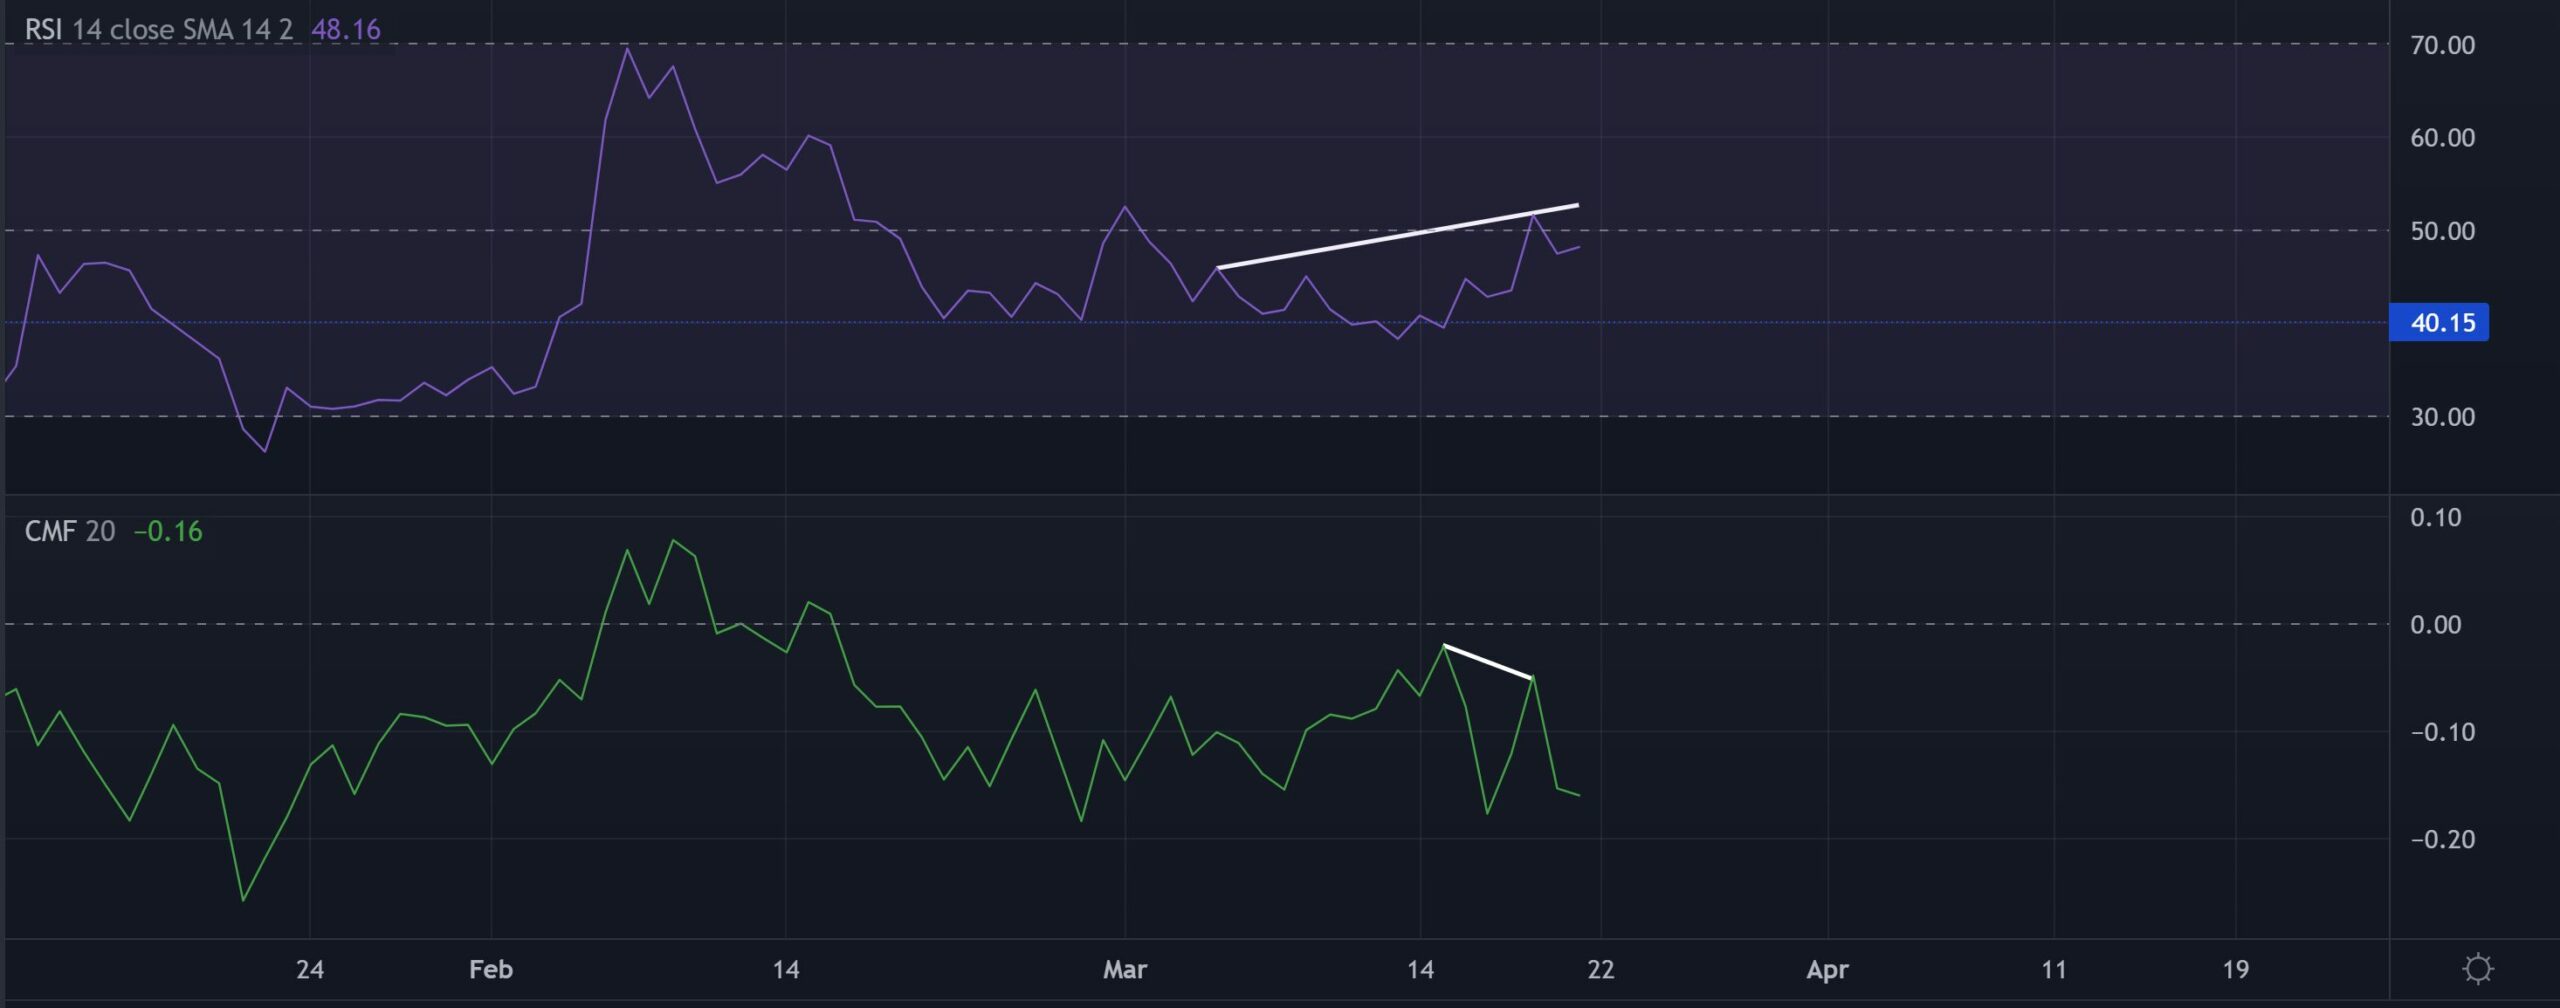
The RSI marked a decent recovery from the 40-mark base. But, it still needs to find a close above the midline to iterate a bullish edge. Any reversal from its trendline resistance (white) would confirm the existence of a hidden bearish divergence.
Furthermore, the CMF took a sharp dip after a bearish divergence with price and visibly chose the bears.
Conclusion
SHIB may be looking at a sustained tighter phase in the near-term before a high volatile move. With a morning star candlestick pattern and the POC support, near-term recovery seems likely before the alt conforms to its bearish tendencies.
Even so, the alt shares a nearly 30% 30-day correlation with Bitcoin. Hence, keeping an eye on Bitcoin’s movement with the overall market sentiment could be essential for making a profitable move.


