Shiba Inu
Shiba Inu poised for a comeback? Watch the critical $0.000024 level
Shiba Inu’s price reached a critical support level. Here’s a look at what SHIB’s next move could be.

- Shiba Inu’s price increased by over 1.13% in the last 24 hours.
- Market indicators looked bullish on the memecoin.
After increasing sharply last week, Shiba Inu [SHIB] turned bearish as its price started to drop. The price decline pushed SHIB towards a critical support level. However, things on the ground somewhat changed, as it was suggested that SHIB might make a comeback.
Shiba Inu reaches a critical level
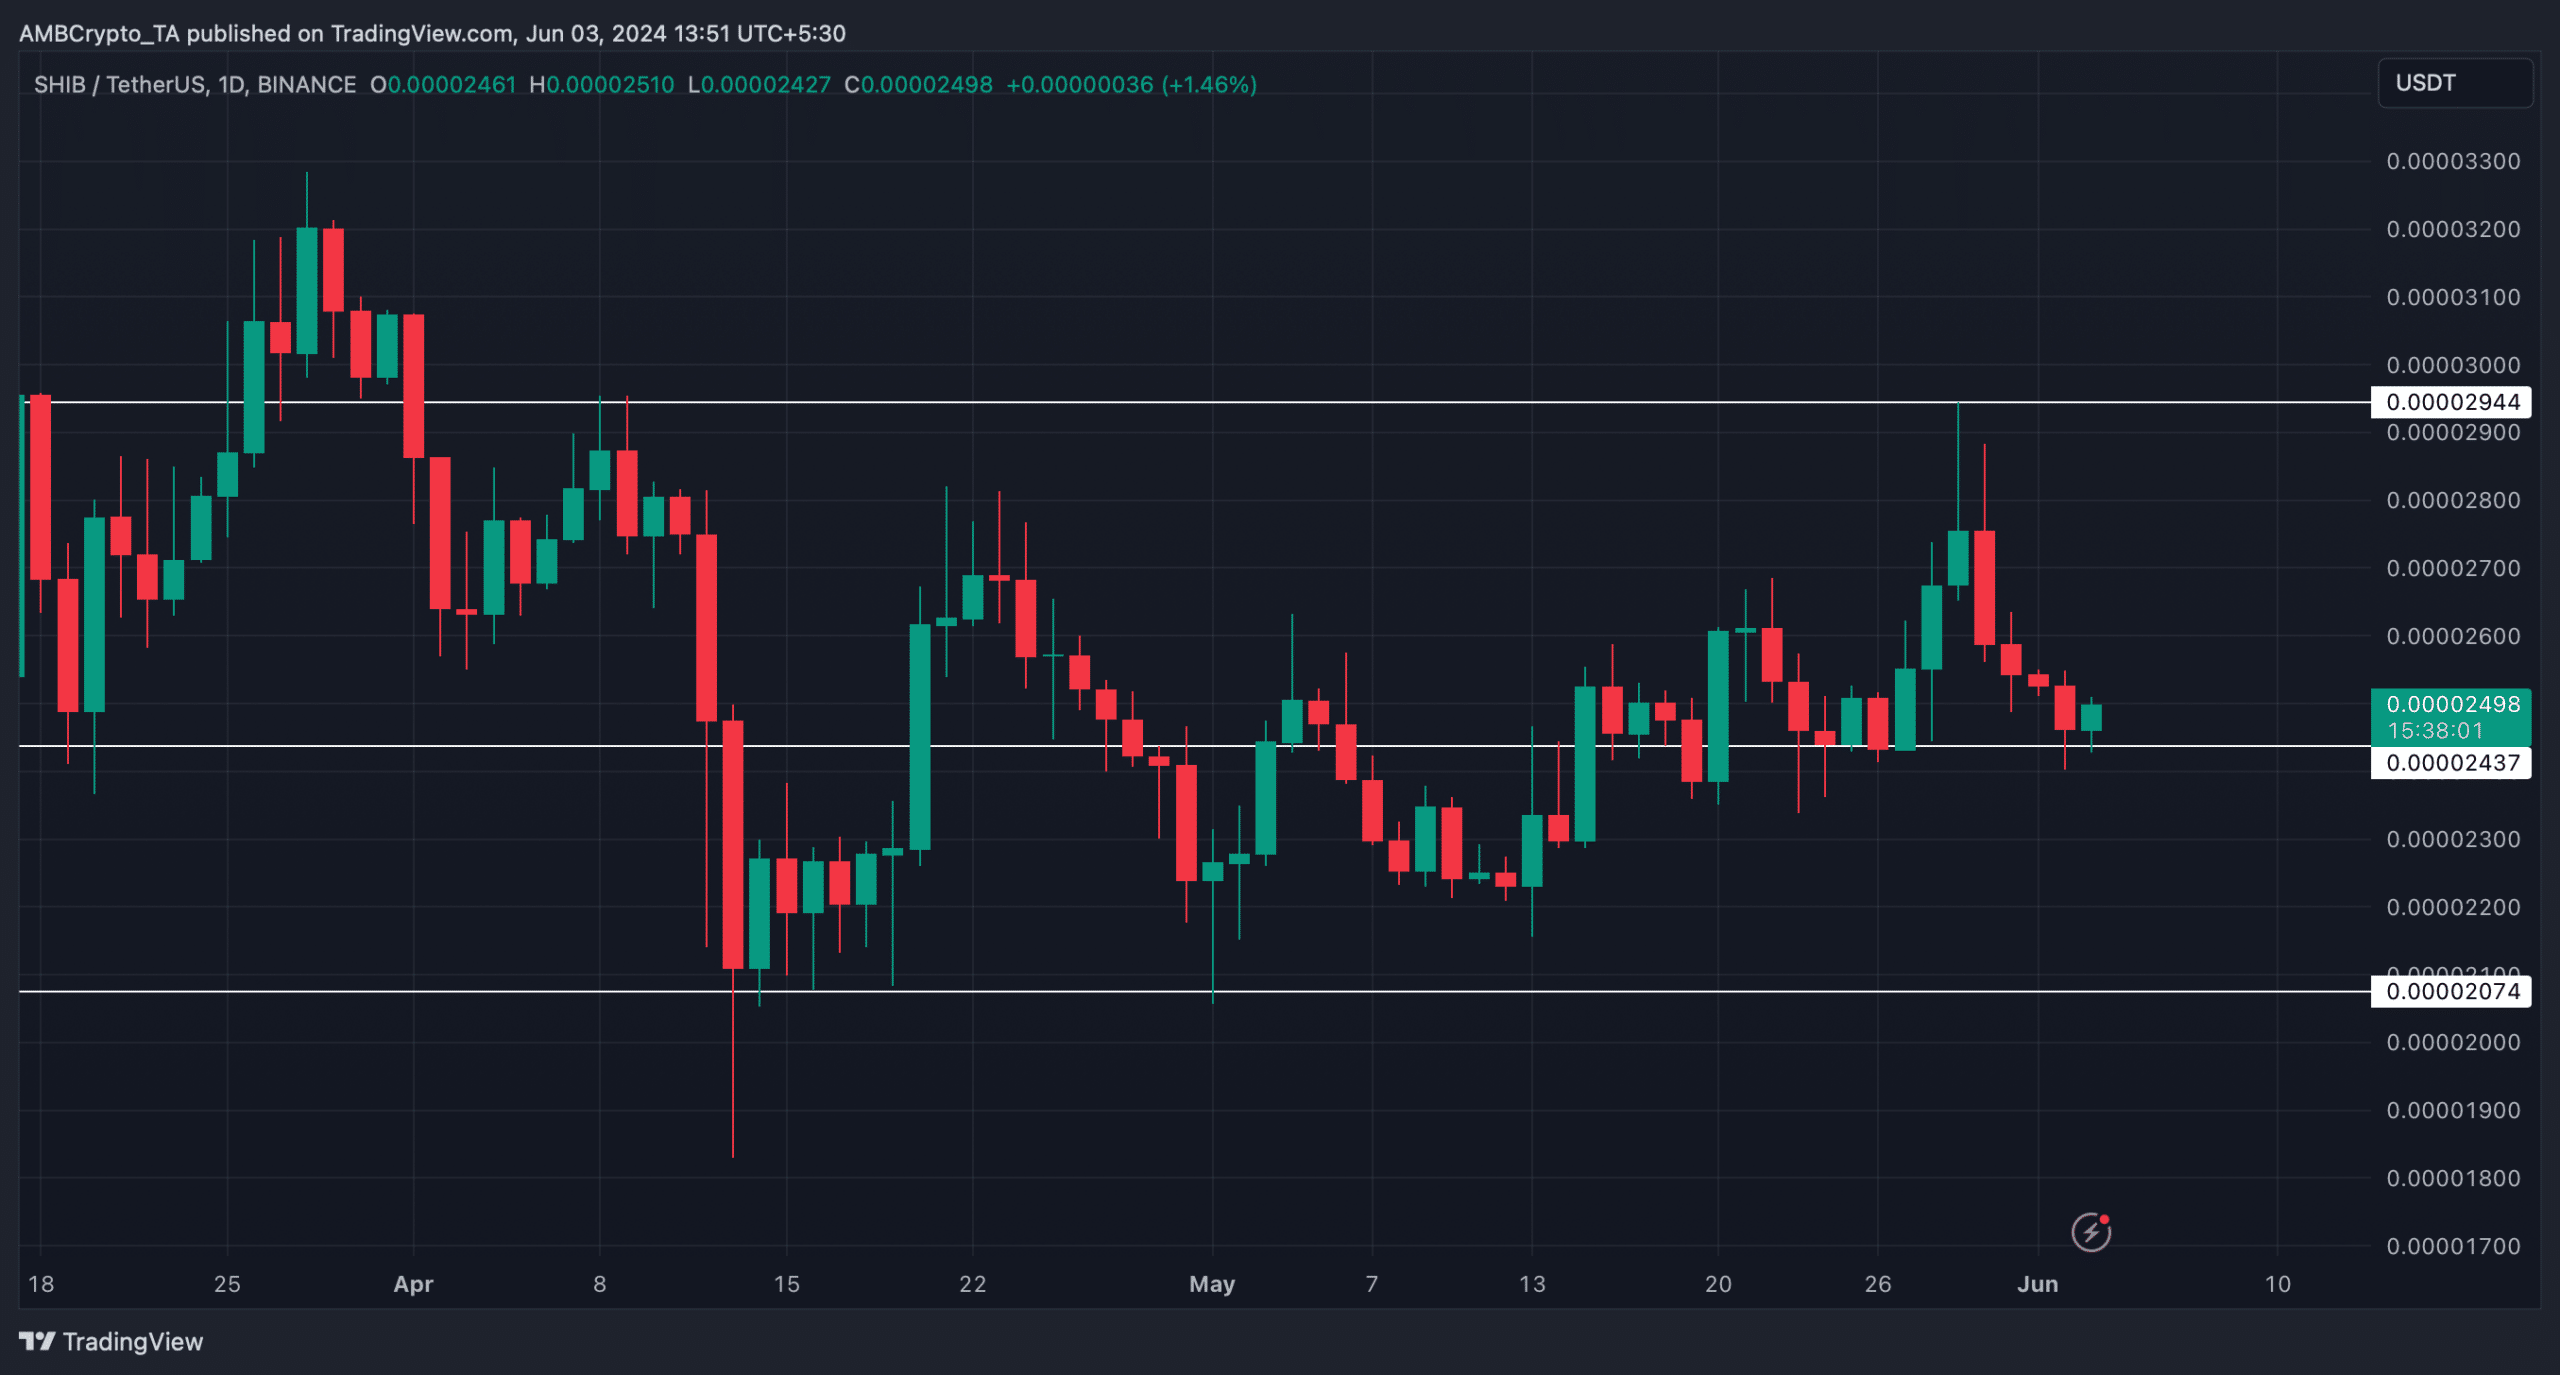
CoinMarketCap’s data revealed that the world’s second-largest memecoin’s price surged substantially on the 29th of May, allowing it to touch $0.00002924.
But SHIB couldn’t sustain the pump and fell victim to multiple price corrections. AMBCrypto’s analysis of the memecoin’s chart revealed that the recent price drop pushed its value to a critical support level of $0.00002437.
If SHIB fails to test the resistance and falls under it, then investors might witness the token drop to $0.000020.
On the other hand, a successful test of the support could kickstart a bull rally, which might result in SHIB touching $0.000029 in the coming days.
Is a bull rally inevitable?
The chances of a successful test were high as the memecoin’s price gained bullish momentum. Shiba Inu’s price had increased by 1.13% in the last 24 hours.
At the time of writing, SHIB was trading at $0.00002499 with a market capitalization of over $14.7 billion, making it the 11th largest crypto.
AMBCrypto’s analysis of Santiment’s data revealed that after a rise last week, SHIB’s supply on exchanges dropped on the 2nd of June.
This indicated that buying pressure on SHIB increased as investors expected its price to increase in the coming days.
Nonetheless, whale activity around the memecoin declined, which was evident from the drop in its whale transaction count.
Additionally, its weighted sentiment also went into the negative zone, meaning that bearish sentiment around SHIB was dominant in the market.
On top of that, Shiba Inu’s fear and greed index had a value of 41, suggesting that the market was in a “neutral” phase.
Whenever the metric reaches that level, it indicates that the market could turn volatile in either direction. Therefore, AMBCrypto then assessed SHIB’s daily chart to better understand what to expect.
Realistic or not, here’s SHIB’s market cap in DOGE terms
The technical indicator MACD’s data revealed that the bulls and the bears were in a battle to gain an advantage over each other. But the rest of the indicators suggested that the bulls might turn out to be victorious.
For example, the Chaikin Money Flow (CMF) registered an uptick, and the Relative Strength Index (RSI) also followed a similar trend, hinting at a successful test of the support.


