Shiba Inu, Solana, Chainlink Price Analysis: 17 November

The global crypto market wavered into its inherent state of volatility. After a vast sell-off, the market saw a noteworthy plunge over the last two days.
Consequently, altcoins like Shiba Inu, Solana, and Chainlink were in the red zone. The near-term technicals undeniably preferred the sellers but hinted at possible ease in their force.
Shiba Inu (SHIB)
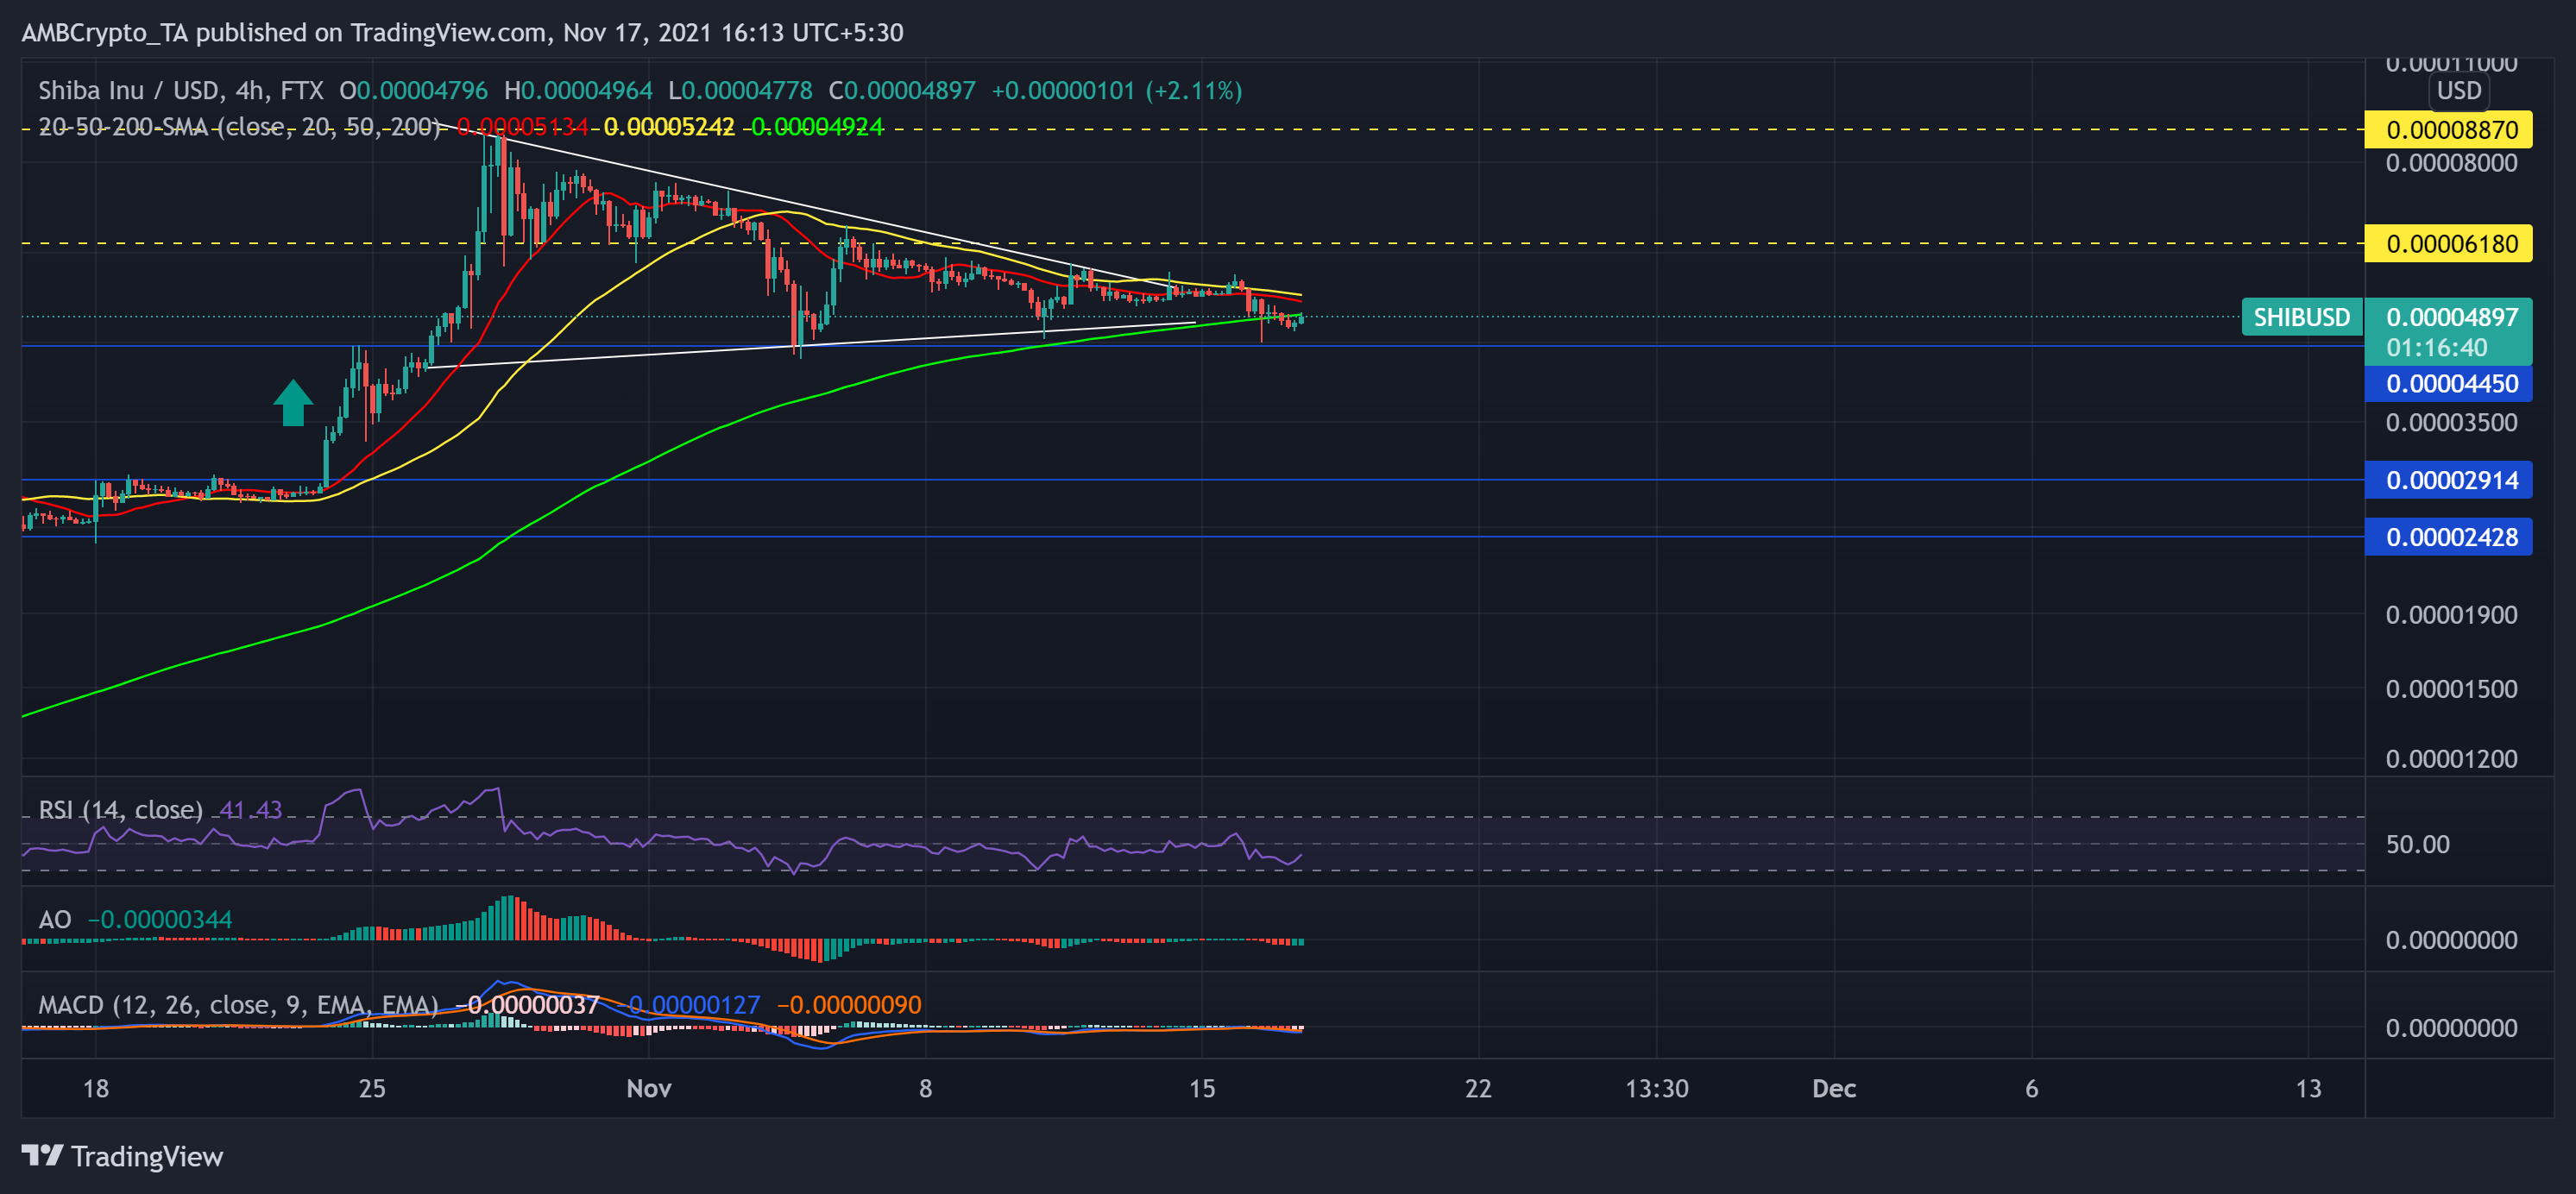
The dog-themed meme token surged by over 200% from 23 October to reach its ATH on 28 October. After which, the price steadily retreated in a descending triangle in the withdrawal phase.
Accordingly, SHIB registered a nearly 39% downfall over the next 16 days until 13 November. Since then, the price action saw an 18.2% blip until the price hit its two-week low on 16 November. This pullback visibly confirmed the increased bearish vigor as the price action fell below the 20-50-200 SMA. While the bears constantly exerted pressure, the SHIB army found support at $0.0000445.
However, the token was still in the green zone on its monthly charts and traded at $0.00004897 at press time. The RSI was near the oversold territory and displayed some revival signs. Additionally, the MACD and AO preferred the selling strength but resonated with the possible revival signals.
Solana (SOL)

The ‘smart contract platform’ recorded a monstrous 85% ROI from 12 October until 6 November. Consequently, the price broke the upper channel to strike its ATH at the $259-mark on 6 November.
However, since then, SOL saw a hefty withdrawal as the price action descended between parallel channels. The southbound price action registered an 18.8% decline and breached the northern parallel channel. The bears further pushed below its immediate support at the $215-mark.
At press time, SOL hopped from the lower parallel channel and traded at $218.62. The crypto saw a 3.02% decrease on its daily charts. The RSI was at the 27-mark, after which it saw a 10 point revival over the past day. Also, the DMI preferred the sellers but did not tarnish the possibility of a bull revival.
Chainlink (LINK)
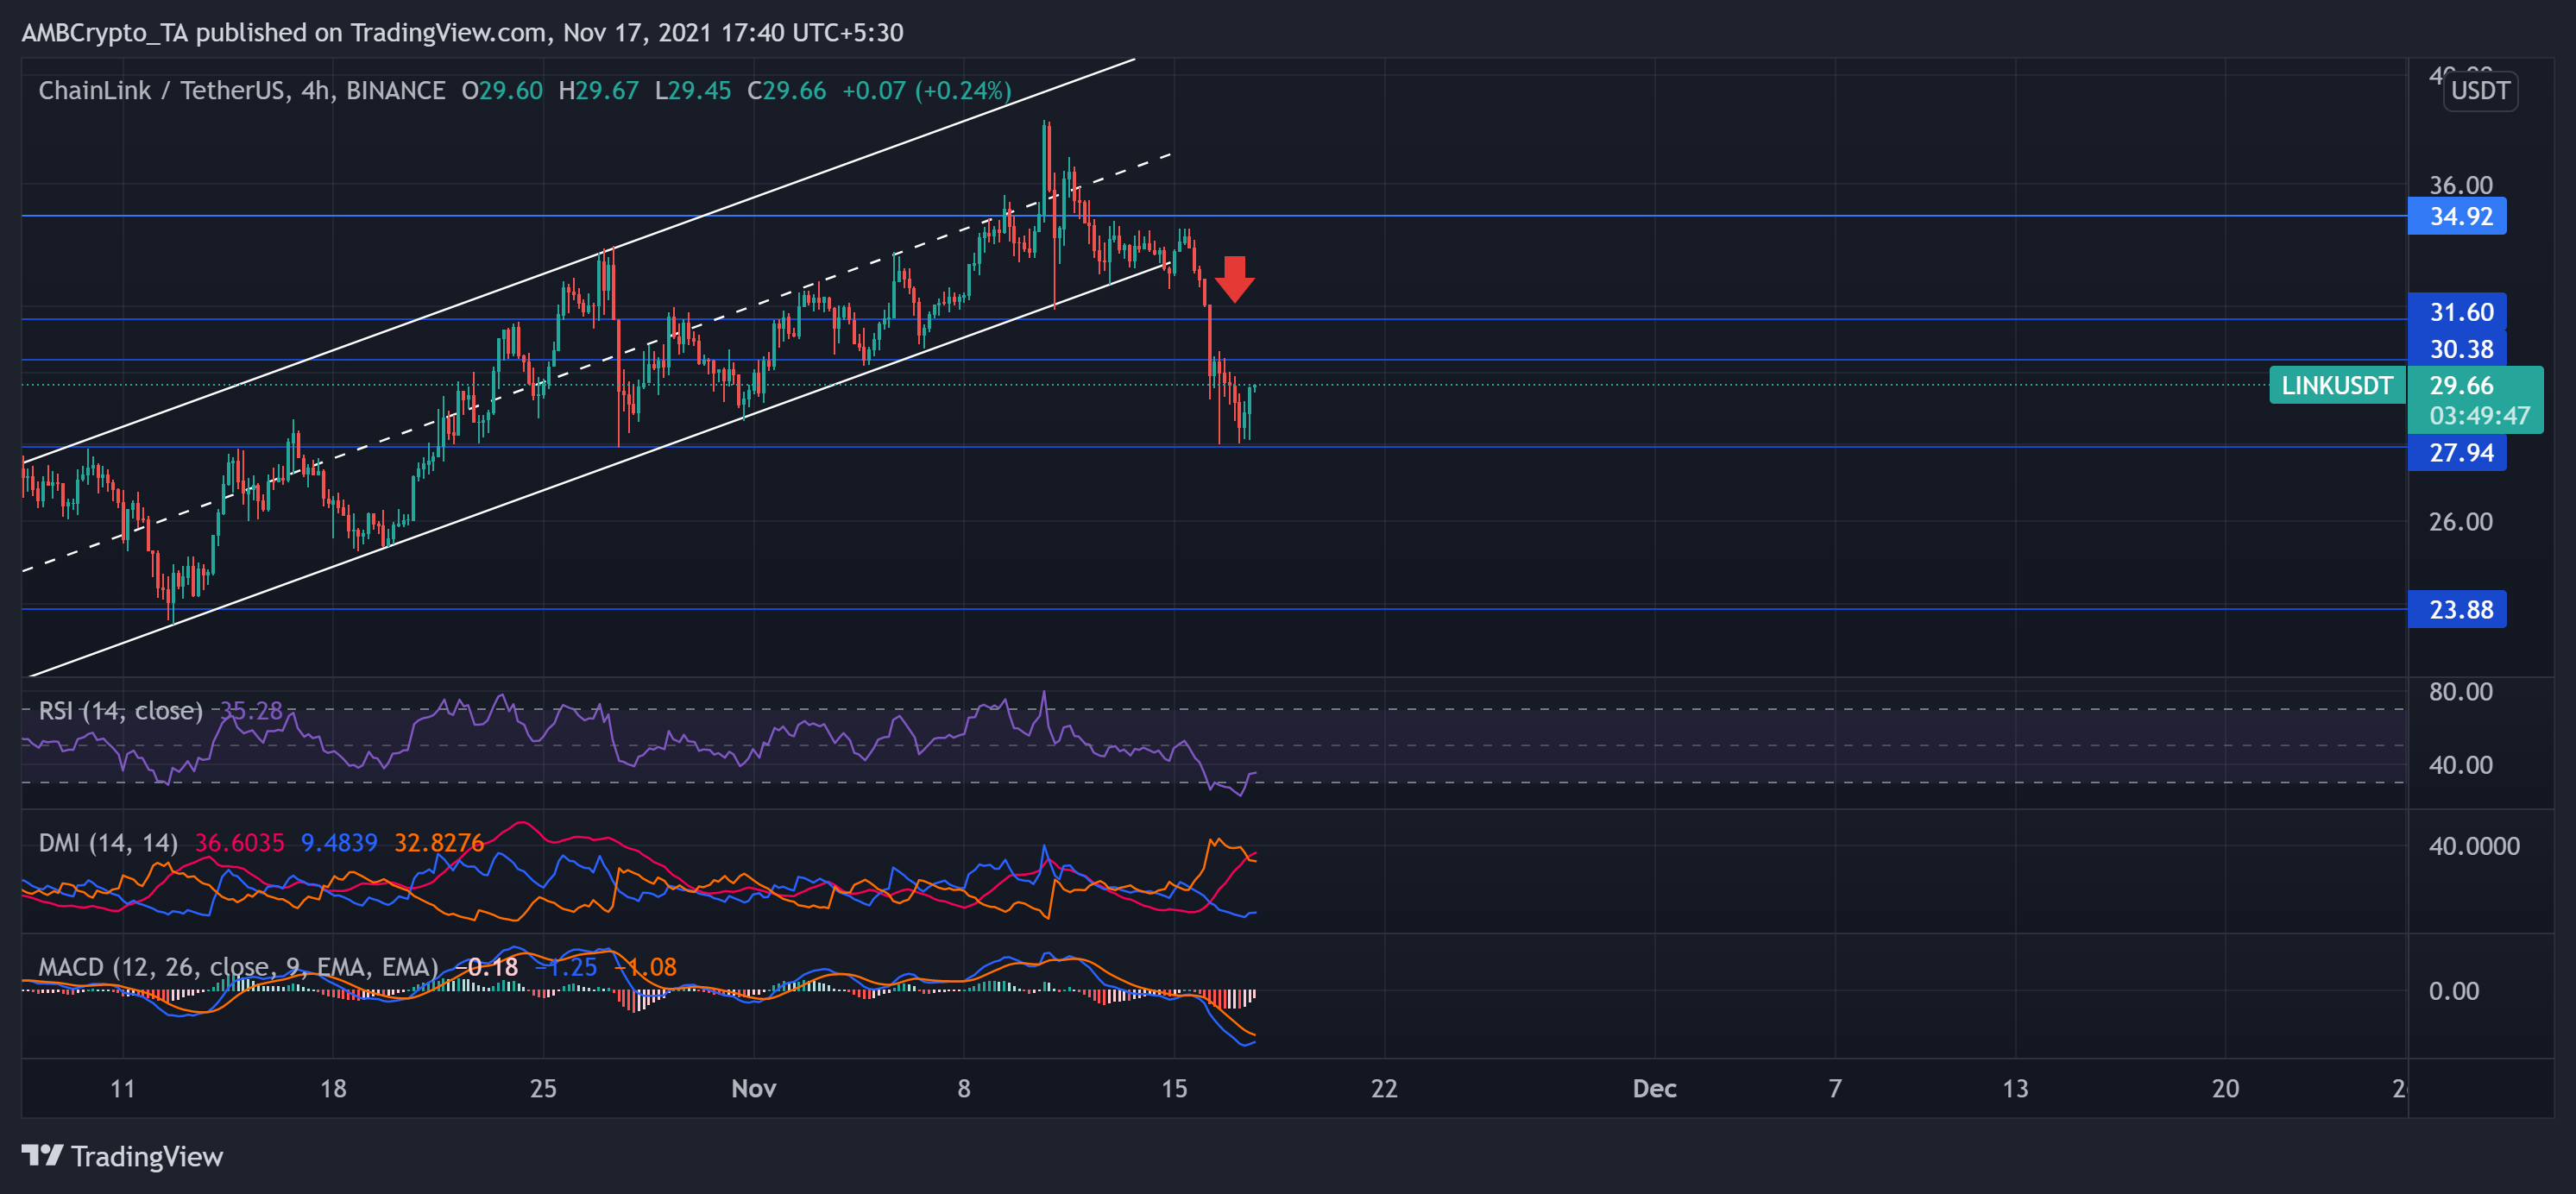
The token registered a staggering 62.08% ROI from 12 October to 10 November. As a result, LINK reached its nearly six-month high on 10 November at $38.31.
However, the bears immediately challenged this milestone as the price reversed below the lower channel after breaching multiple support levels. With profit-taking in full swing, LINK declined by 22.9% over the last week. At press time, LINK traded at $29.66 while the bulls ensured support at $27.94.
The RSI was near the oversold territory after surging from below that region. Further, the DMI showed a distinguished preference for the bears. Nevertheless, the MACD flashed shorter light red bars, not discarding the possibility of possible ease in bearish momentum.