Shiba Inu’s price will be determined by these factors going forward

On higher time frames, Shiba Inu reached an area of significance at $0.029 (Note: All SHIB prices in the following article are 1000x the actual value, to do away with long decimal places. For example, a SHIB price of $0.00003319 written as $0.03319).
It saw buyers step in at that area and indicated a rally could begin in the days to come. Since then, SHIB has gained nearly 26% to reach the $0.0378 level of resistance.
SHIB — 1-hour chart
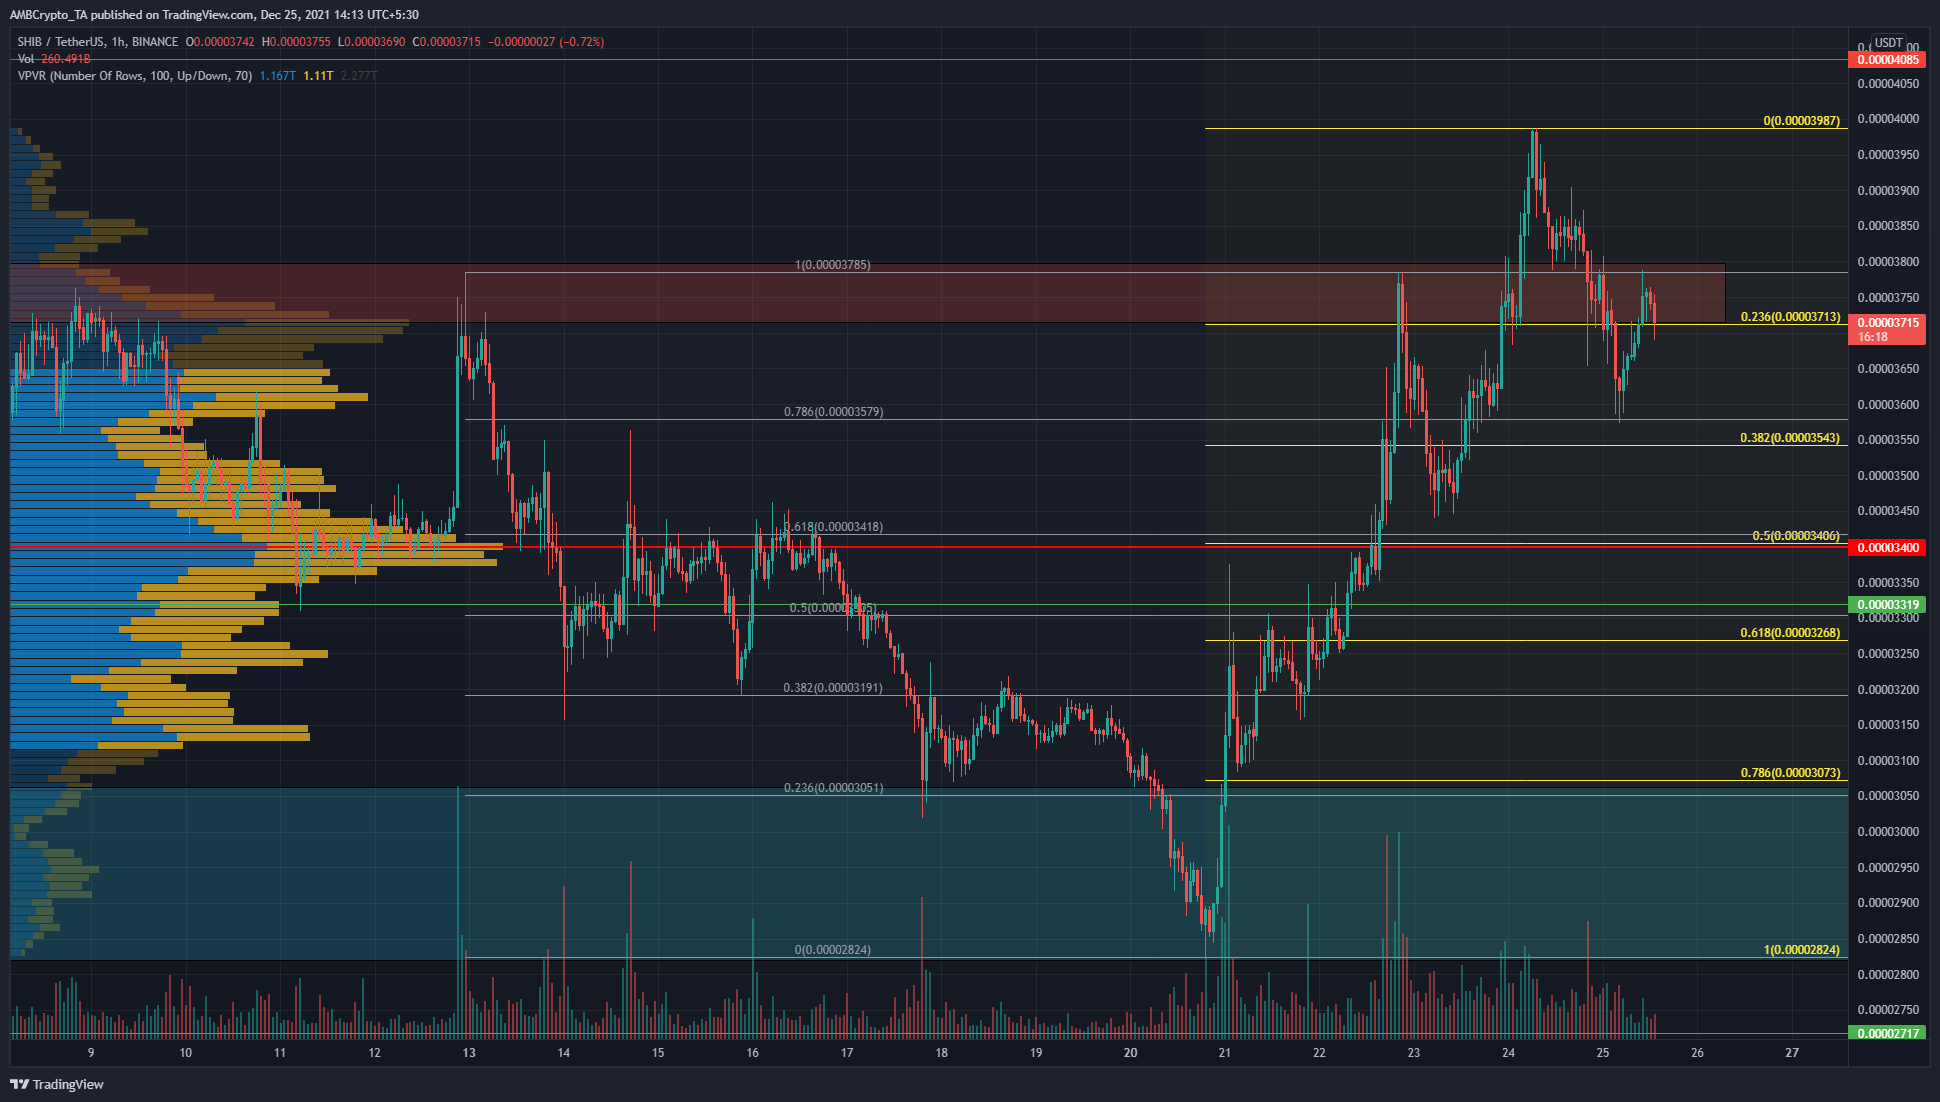
Two sets of Fibonacci retracements were used, the gray from $0.03785 highs to $0.0284 lows, and the yellow from $0.0284 lows to $0.03987 highs. The two sets of retracements had confluence (overlap) at the $0.034 area.
The $0.034 level was also the Point of Control (PoC) highlighted by the Visible Range Volume Profile. The price was well above this level, a sign of short-term bullish strength. A revisit of the $.0357 level was also bought up to push the price to the $0.037 area of resistance once again (red box).
This area also has retracement levels for the recent moves SHIB saw, alongside being an important level on lower time frames. Hence, SHIB could move sideways for a while before expansion.
Rationale
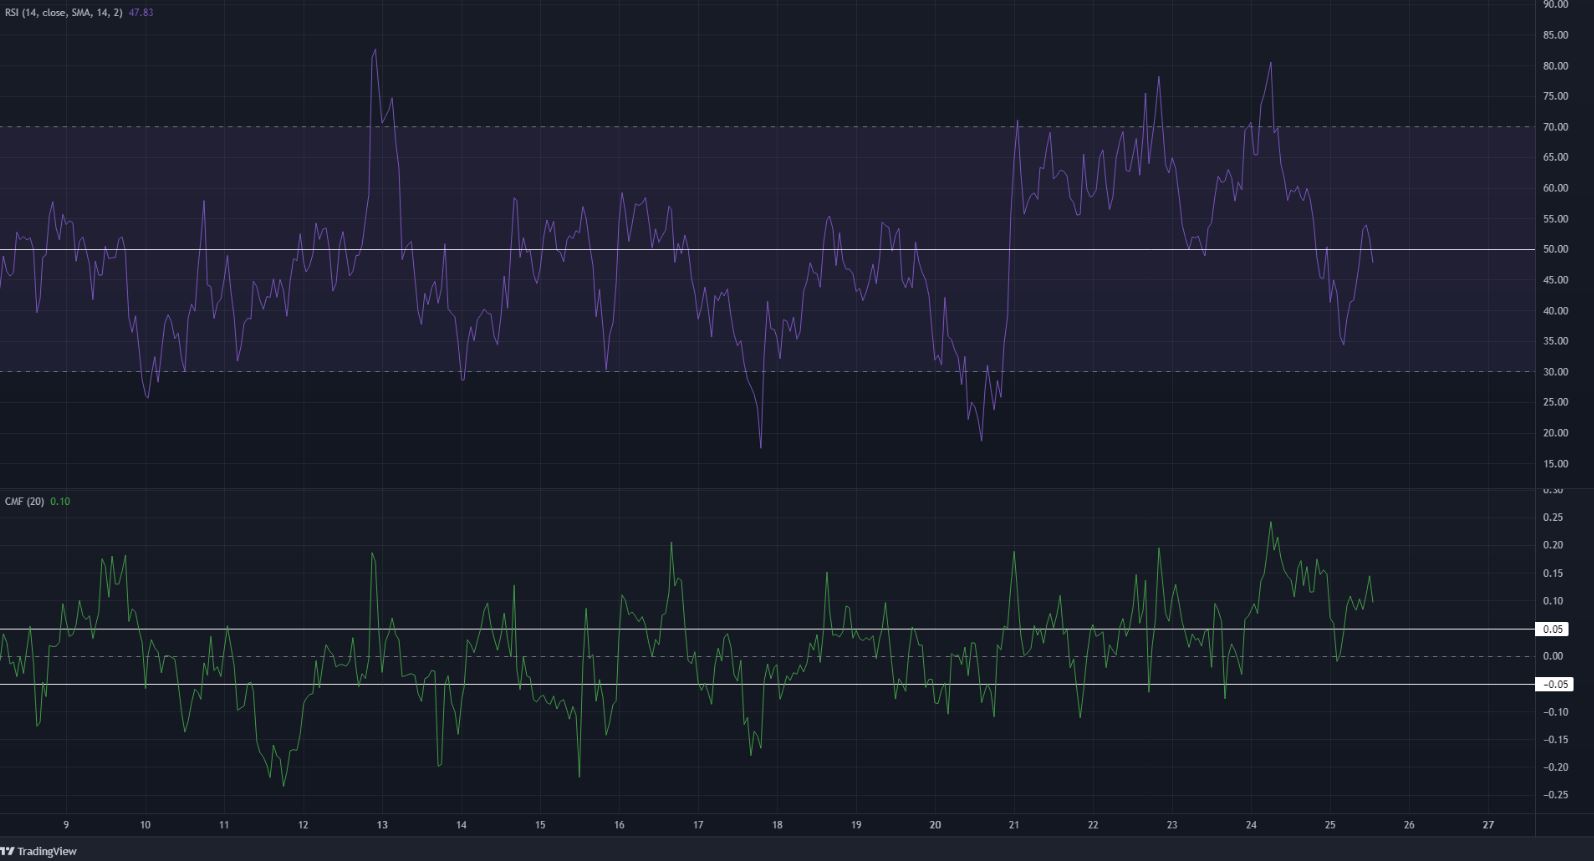
The RSI momentarily climbed above neutral 50 but was rejected pretty quickly. This could see SHIB dip once more, possibly by as much as 4% to the $0.0355 area.
The CMF was above +0.05 to show that capital flow was into the market still, and buyers held more strength in the market over the past couple of days.
Momentum stalled but buyer strength was still in evidence, and this meant that SHIB was more likely to consolidate at/below $0.037 for some time before another leg upward.
Conclusion
Bitcoin will also have a strong say on Shiba Inu’s price movement. In the short term, SHIB momentum was neutral and a revisit to $0.035 could occur. However, if Bitcoin continued to rise/stay above $50.8k, SHIB could have a chance to run higher.
The 61.8% extension level of the move from $0.0282 lows was at $0.047, which had confluence with a higher time frame resistance. This confluence lent credence to this (yellow) set of Fibonacci retracement levels.
Disclaimer: The findings of the following analysis are the sole opinions of the writer and should not be taken as investment advice