Short-term Shiba Inu [SHIB] investors should be cautious because…
![Short-term Shiba Inu [SHIB] investors should be cautious because...](https://ambcrypto.com/wp-content/uploads/2022/12/jaycee-xie-TcByXvrIrno-unsplash-2-e1670407479135.jpg)
- SHIB faced a key resistance at $0.000000934
- The market structure was neutral, but SHIB could drop $0.000000920.
The meme coin, Shiba Ibu (SHIB) lost 8% of gains made on 5 December after a price correction wiped it all. At press time, it was trading at $0.000000931 and showed a mild bullish momentum on the lower timeframe charts (3-hour chart).
However, the technical indicators showed that SHIB’s current market structure is neutral, with no clear direction for traders to make convincing gains.
On the other hand, on-chain metrics painted a bearish outlook that could see SHIB drop to $0.000000920 or lower before bouncing back.
SHIB struggling to break above the $0.000000934 resistance: will it drop lower?
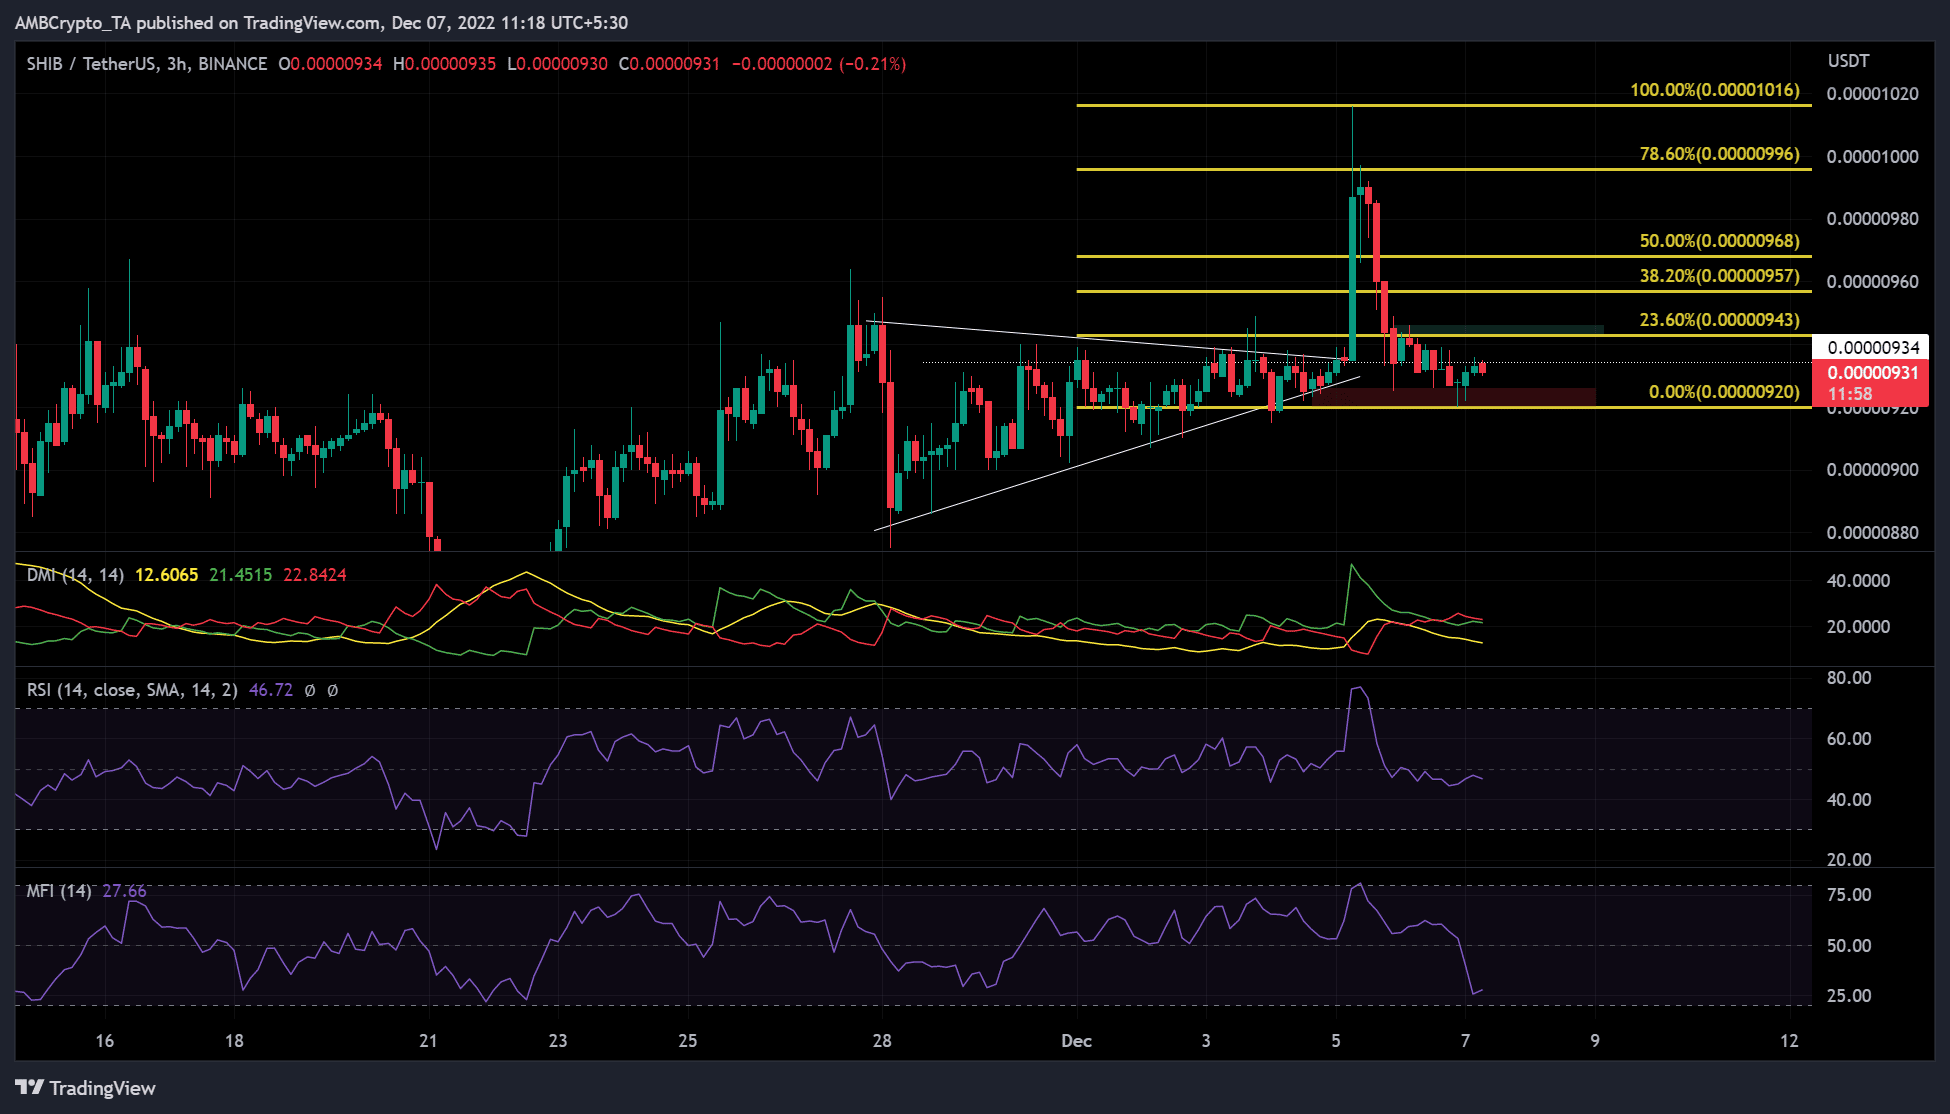
SHIB’s price movement from 28 November chalked a bullish symmetrical triangle pattern. The breakout offered traders over 8% in gains. Afterward, a price correction that followed wiped out all the profits and set SHIB on a fresh start.
At the time of publication, the mild bullish momentum on the 3-hour chart could not be sustained. In particular, the Directional Movement Indicator (DMI) showed that the red line (sellers) and green line (buyers) are below 25. Therefore the market is not leaning in any specific direction but is neutral.
On the other hand, the Relative Strength Index (RSI) had retreated from the oversold territory and was moving below but near the neutral mark. This implies that buyers have lost significant leverage but can’t be ignored completely.
In fact, the Money Flow Index (MFI) registered a slight uptick after making a u-turn from lower rangers bordering oversold territory. This shows that a small accumulation of SHIB has taken place, and we could expect an uptrend.
However, SHIB’s metrics (discussed below) paint a bearish outlook that could send SHIB to $0.000000920.
But a candlestick close above $0.000000943 will invalidate the above bearish inclination.
A decline in trading volume and favorable weighted sentiment
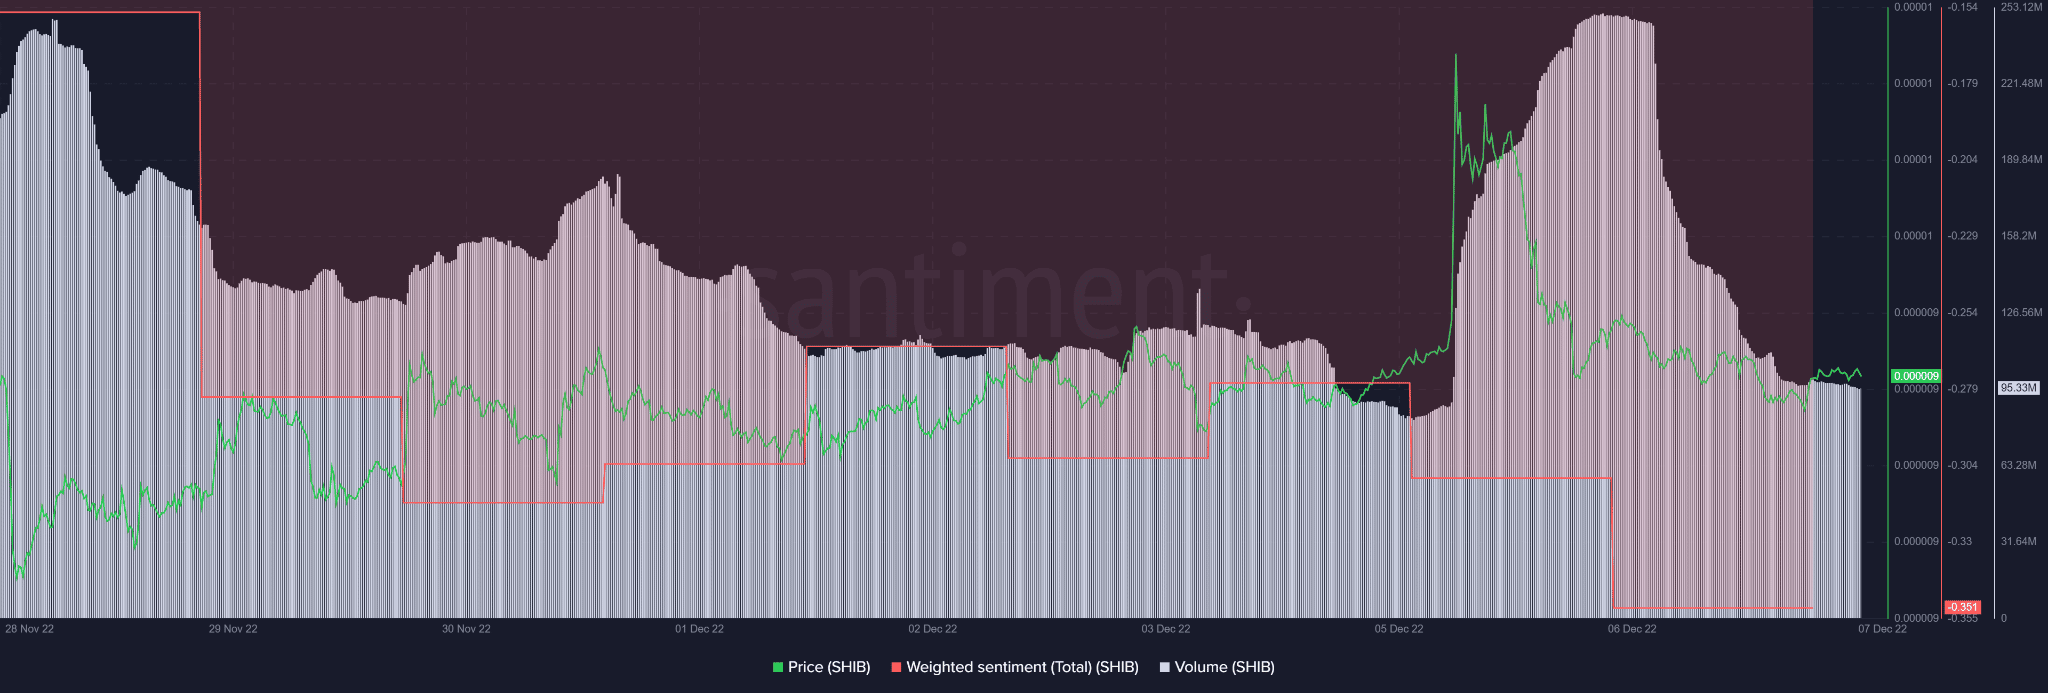
According to Santiment, SHIB’s weighted sentiment moved deeper into the negative territory. This implies a strong, bearish outlook that could lower SHIB’s price. Moreover, a drop in trading volume could undermine further buying pressure. Thus, SHIB could drop to $0.000000920.
However, a bullish BTC could propel it past $0.000000943 and invalidate the above bearish forecast.