Should investors wait for a 60% comeback of SAND amidst market capitulation

Sandbox price is fast approaching a vital support zone that is likely to absorb the incoming selling pressure and kick-start a bull rally. The bullish perspective for SAND is backed by on-chain metrics, suggesting a similar outlook.
A brief yet bullish future
Sandbox price has crashed roughly 68% in the past four months and is currently sliding lower, approaching the $1.53 to $2.44. A bounce off this level will likely witness a strong surge in buying pressure, triggering a minor uptick for the token.
In Sandbox price’s case, the bounce-off is not the first problem, but the nearing of Simple Moving Averages (SMAs) is. Therefore, the upside for SAND is extremely dense and will require a strong and stable amount of buying pressure.
A quick reaction of the demand zone will likely propel SAND by 28% before retesting the 200-day SMA at $3,179. Flipping this barrier could see Sandbox’s price make a run at the next target at $3,49.
In a highly bullish case, SAND is likely to make its way to the 100-day SMA at $4.28. In total, this run-up would be a 60% gain and is likely where the Sandbox price will set a swing high and retrace.

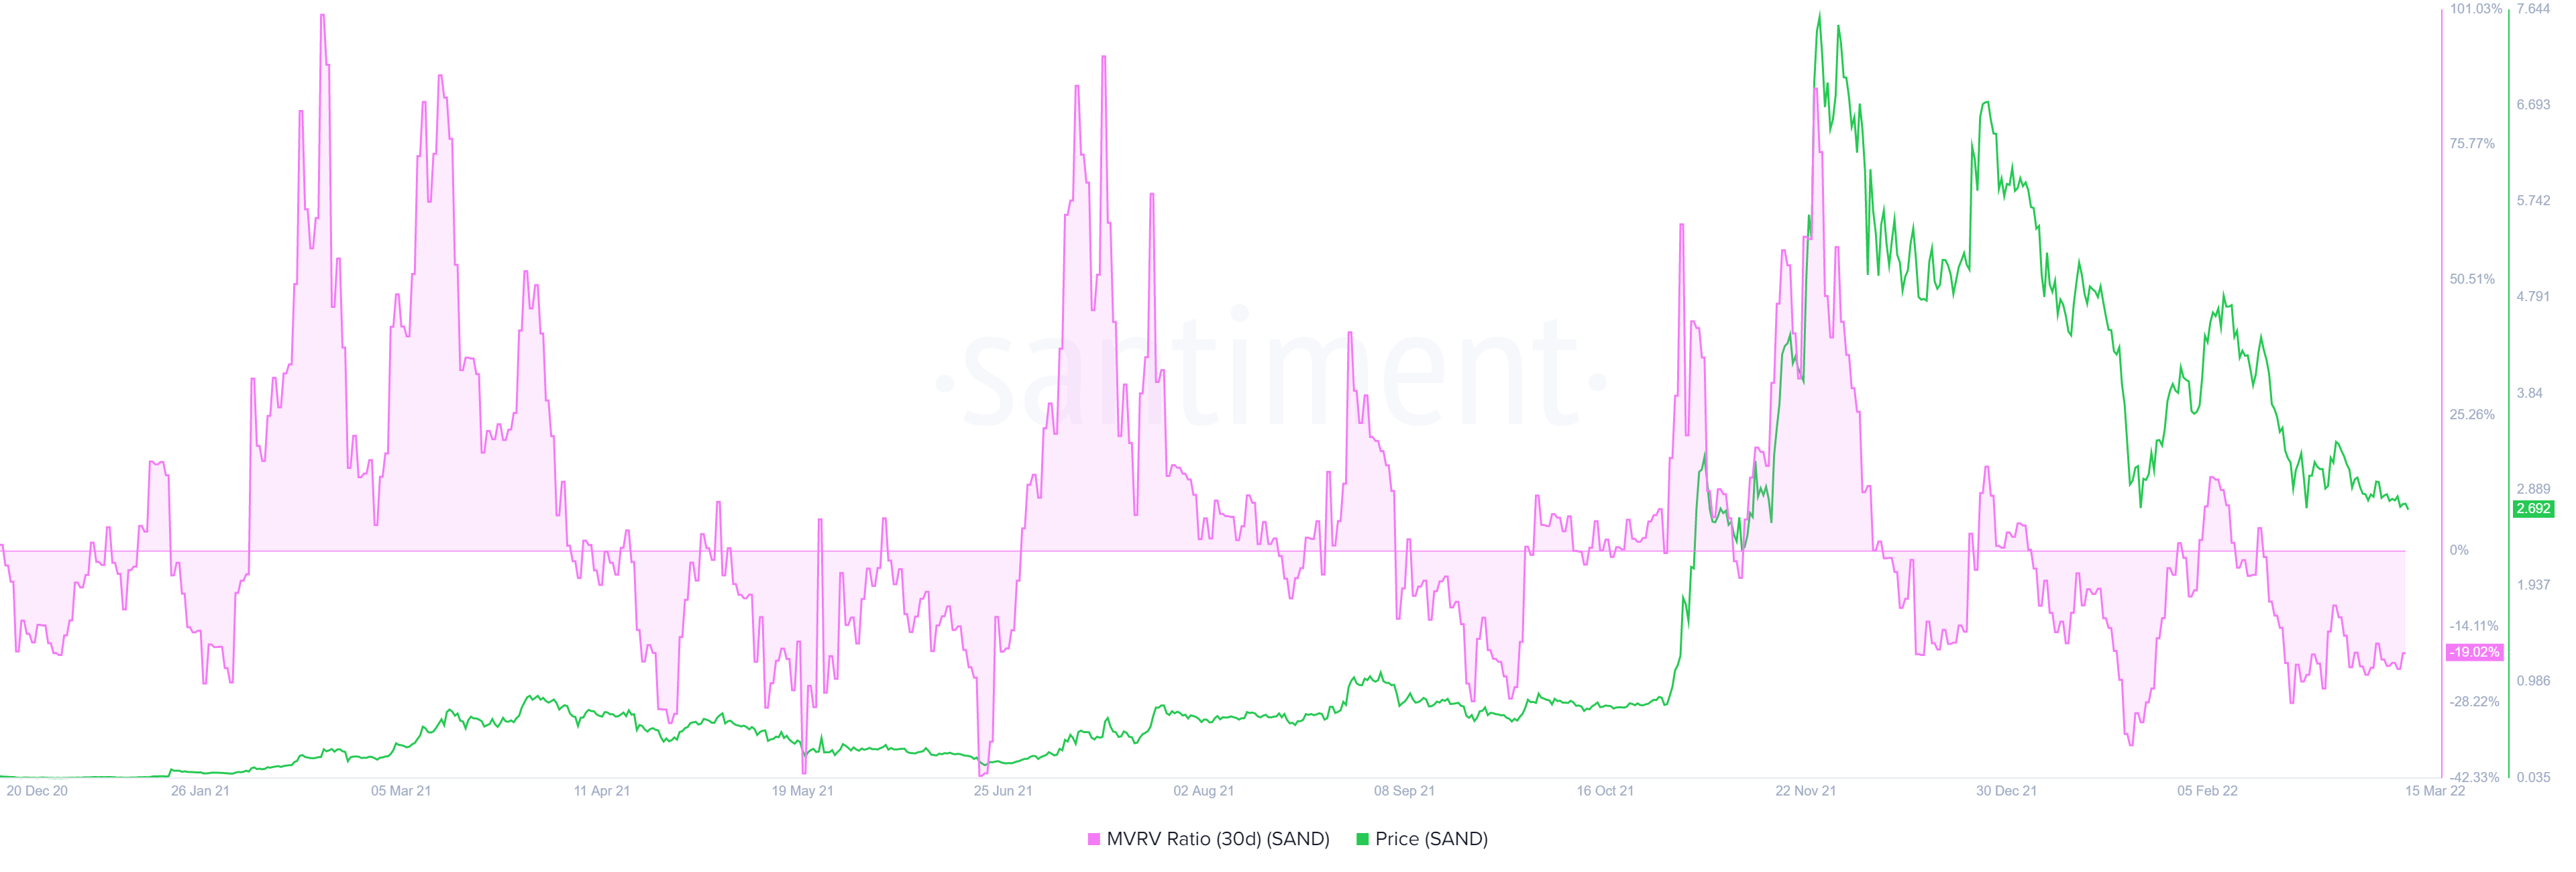
Supporting this exponential run-up for Sandbox price is the 30-day Market Value to Realized Value (MVRV) model, which is hovering at -19%. This indicator is used to assess the average profit/loss of investors who have purchased SAND tokens over the past year.
A negative value below -10% indicates that short-term holders are at a loss and are typically where long-term holders tend to accumulate. Therefore, a value below -10% is often referred to as an “opportunity zone.”
For the last year or so, the SAND price has seen a considerable reversal in its price as MVRV hits -18%. In fact, Sandbox’s price has rallied 25% to 50% twice in the last four months when the 30-day MVRV hit -18% or lower, adding credence to the bullish thesis.
While things are looking up for Sandbox’s price, there is a good chance this outlook could turn sour if bears take over. A breakdown of the $1.53 support level will invalidate the demand zone and, therefore, the bullish thesis detailed above.
In such a case, SAND could slide lower and find stable support levels until sidelined buyers decide to step in and give the bull rally another attempt.


