Should SAND holders practice caution as rough days lie ahead

Bitcoin was unable to breach the $45,500 local highs and had also fallen below the $44,400 and $42,000 support levels, all within the past week. This implied that SAND had been recovering well from the sell-off in January.
Early February was bullish for the coin as it climbed past the $4.44 resistance level- but it was rejected at $4.82. Does this mean that SAND will revisit the $2.5 lows again in the coming weeks? In other news, designer brand Gucci acquired an ‘undisclosed amount’ of land on The Sandbox, in order to expand its presence in the Metaverse for its Gen-Z-focused platform Gucci Vault.
SAND- 12H
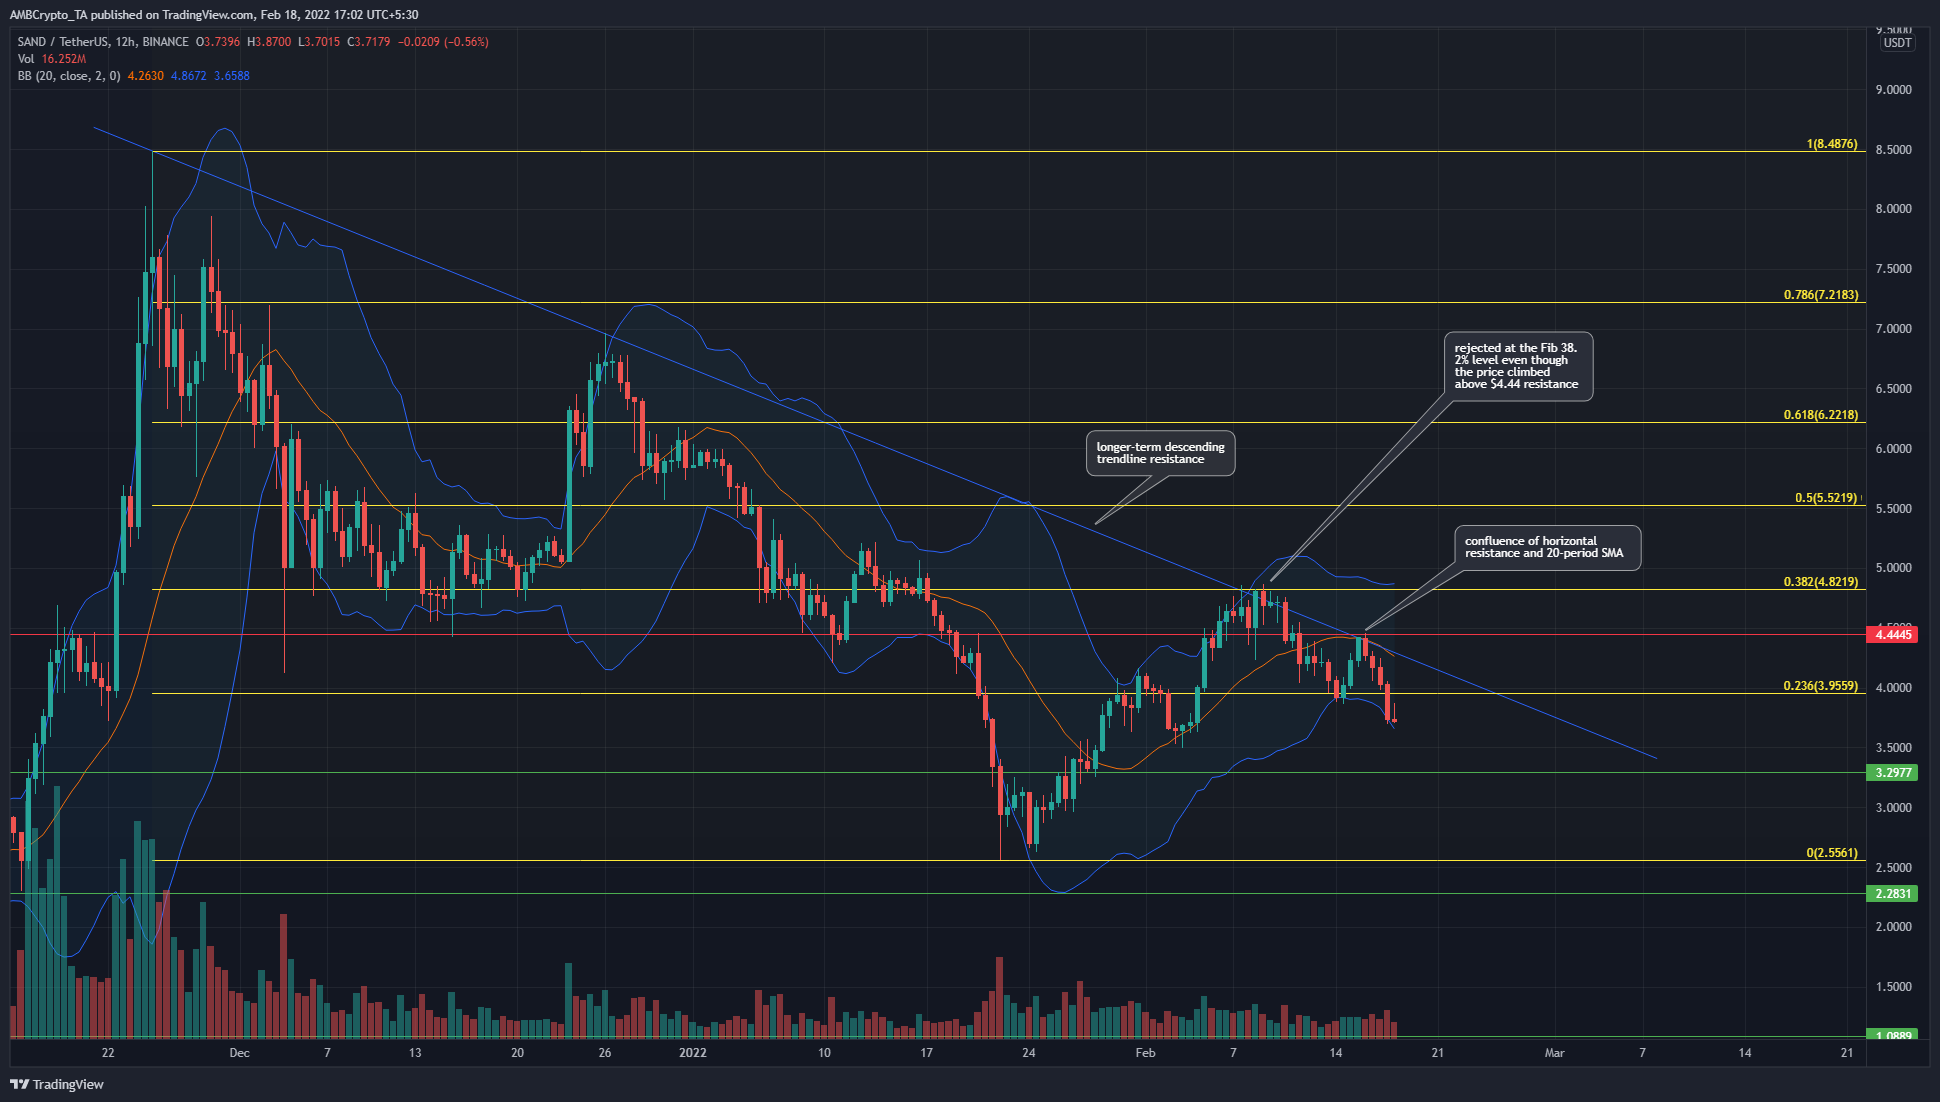
Based on SAND’s move from ATH $8.48 to $2.55 late in 2021, a set of Fibonacci retracement levels (yellow) were plotted. The 38.2% retracement for this move stood at $4.82. Generally, the price tends to bounce as high as the 50% and 61.8% levels during a retracement, before its next move in the prevailing trend’s direction.
However, the $4.8 level had been a strong support level in early December, and its retest as resistance in the past couple of weeks did not bode well for SAND bulls in the weeks to come.
The price descended below the $3.95 level as well, and the next support levels lay at $3.29 and $2.55, with $3.55 also a possible place for a bounce to be seen. Since the price was unable to hold on to $4, it appeared possible that its next leg southward was in motion.
Rationale
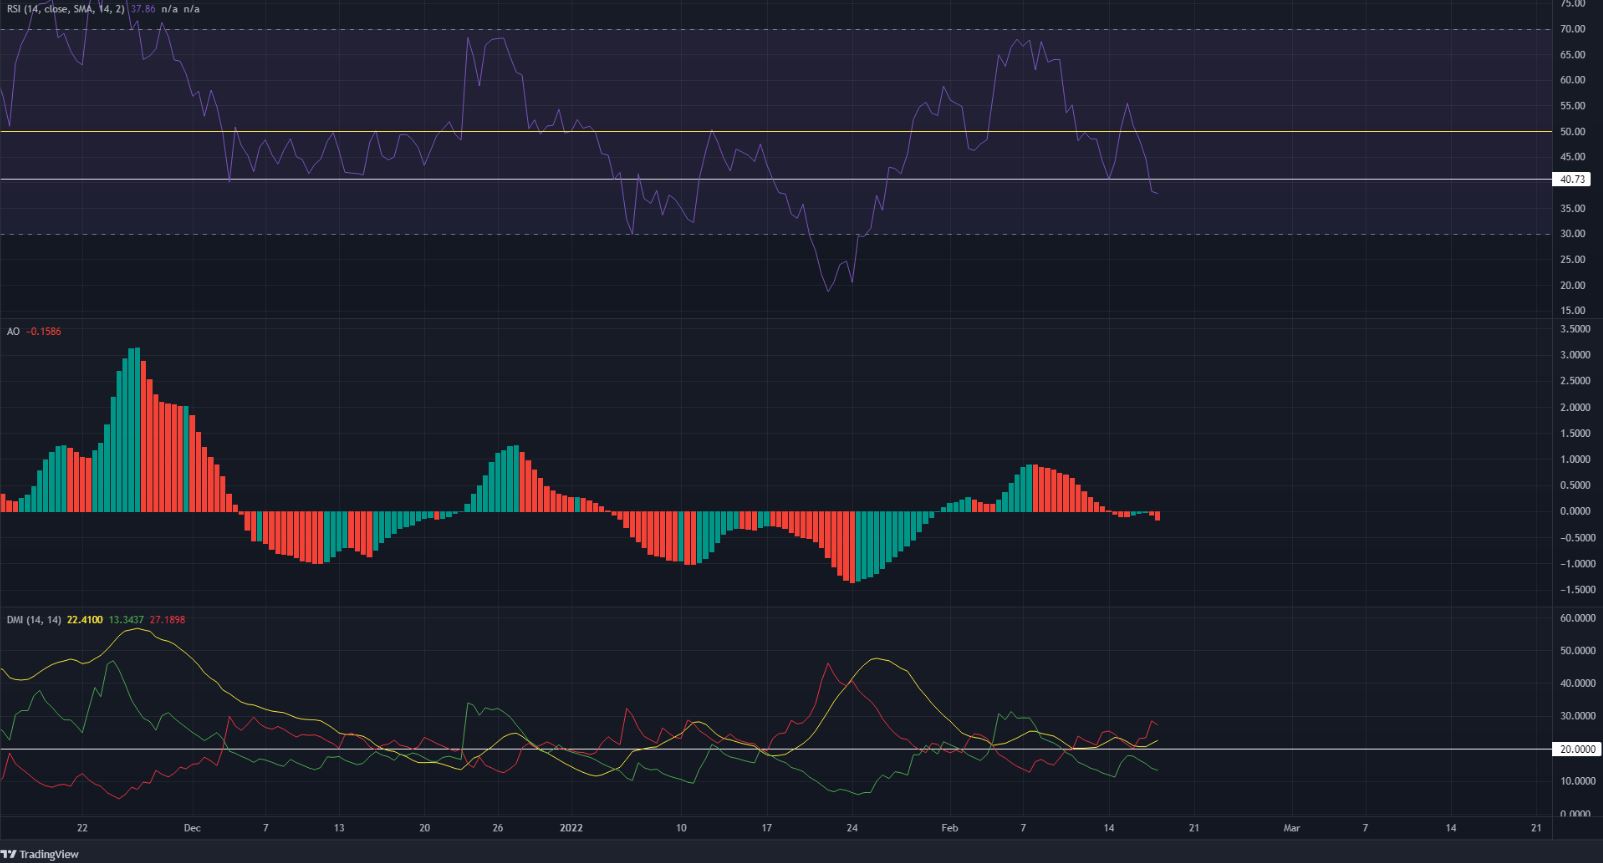
The 12-hour RSI fell below the 40 value – in the past, this has generally seen SAND shed value quickly in a matter of days. However, this was something that could repeat once more. The Awesome Oscillator also fell below the zero line, to highlight mounting bearish pressure.
Moreover, the Directional Movement Index showed a strong bearish trend in progress as both the ADX (yellow) and the -DI (red) were above the 20 mark.
Furthermore, the Bollinger bands showed that the price was near the band’s lows, while the 20 SMA (orange) on the price chart had also served as resistance recently, at the $4.44 mark.
Conclusion
Bitcoin could be headed toward the $38,000-$39,000 area before a possible bounce. In the meantime, selling pressure grew strong behind SAND, as the momentum indicators painted a bearish picture. In the next few weeks, a move toward $2.5 could materialize. And, the $2.2-$2.5 area, if visited, could actually turn out to be a bargain price for SAND in the months to come.
Disclaimer: The findings of this analysis are the sole opinions of the writer and should not be considered investment advice.