SILLY: Prediction foretells 20% fall, will price hit $0.05?

- SILLY could fall another 20% in the coming days.
- The H4 price action marked out an area of interest for the sellers.
Silly Dragon [SILLY] is down 60% from its ATH at $0.1591 the token registered on the 27th of December. AMBCrypto’s technical analysis of the newly launched token showed that the initial enthusiasm has evaporated.
In its stead stood a steady wave of selling pressure. The indicators showed some buying pressure in the past few days, but the price action maintained a bearish outlook. Another 20% drop in prices was likely inbound.
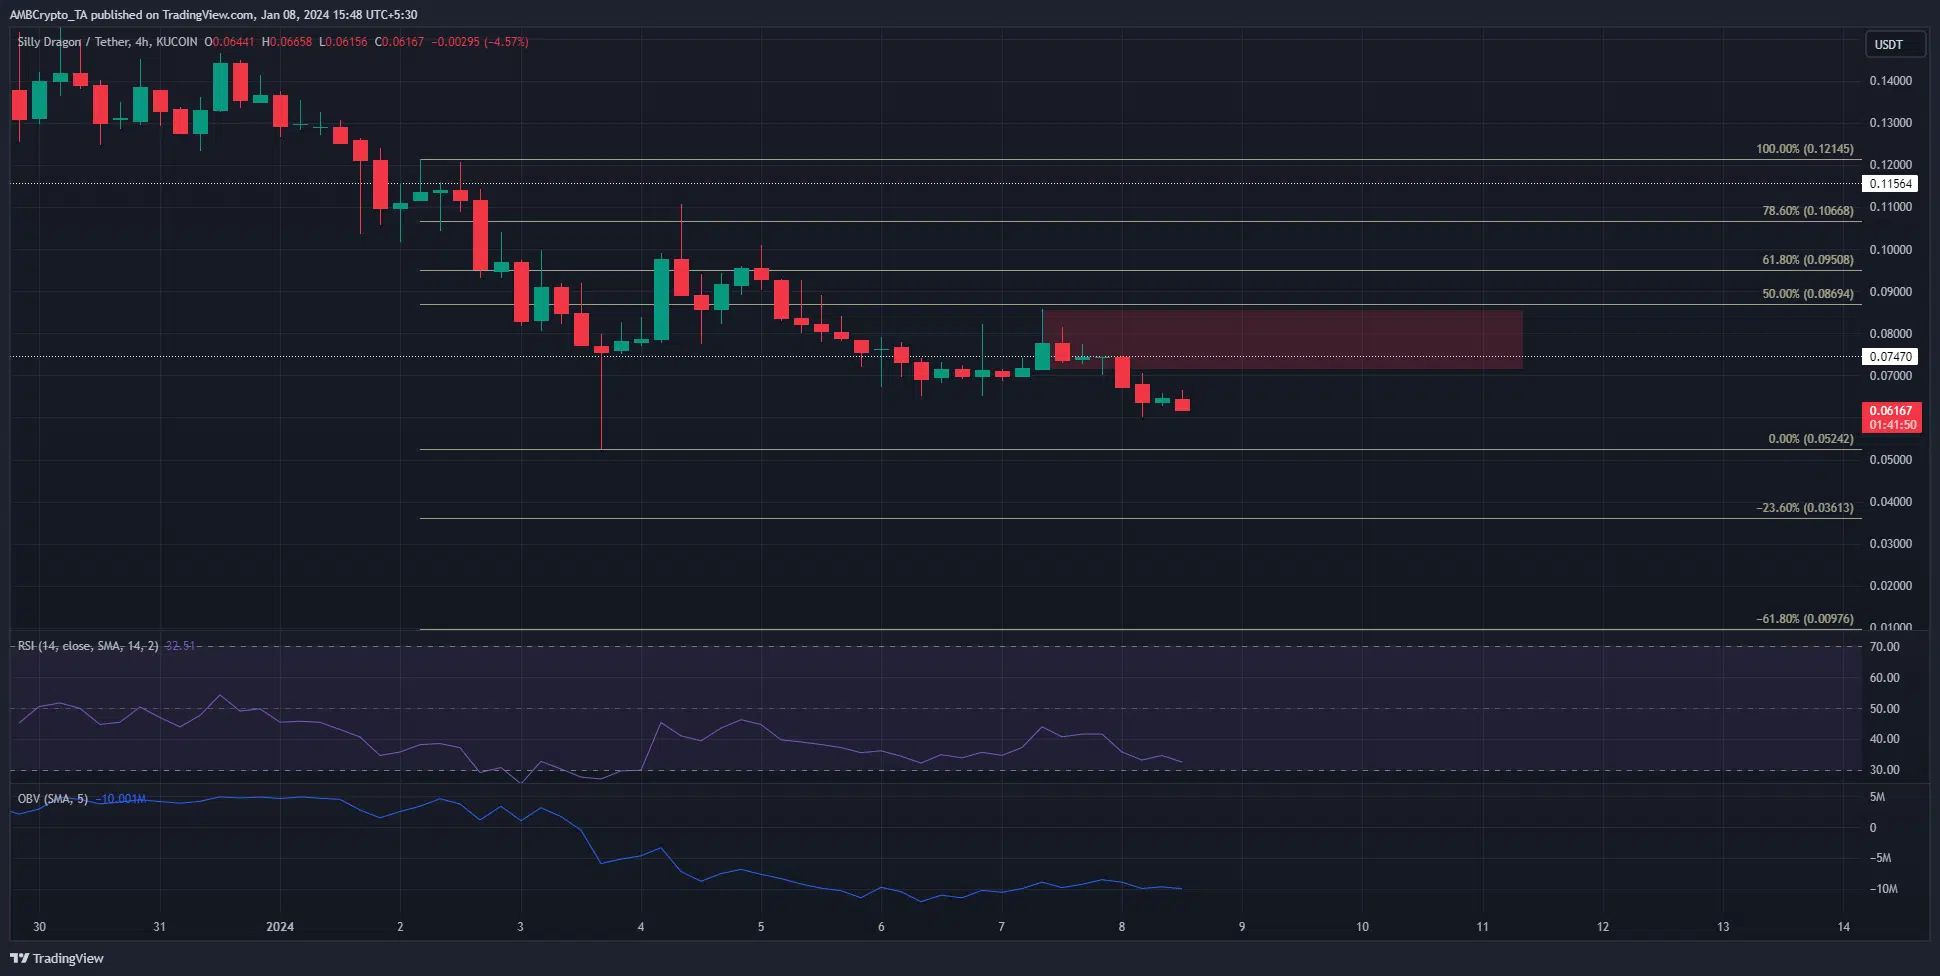
The bearish market structure demarcated a firm supply zone
On the 1st of January, the 4-hour price chart showed SILLY fell below the $0.1156 support level. This flipped the market structure bearishly after the initial surge toward December’s end.
Since the 1st of January, SILLY has set a series of lower highs.
A set of Fibonacci retracement levels (yellow) was plotted based on the price drop to $0.0524. SILLY reached this level on the 3rd of January and bounced to the 78.6% retracement level on the 4th of January.
This bounce measured 111.18% within a day, but the structure remained bearish.
The RSI was also below neutral 50 to highlight the downward momentum. Since the 6th of January, the OBV has slowly ticked higher. Yet, this amount of buying volume was likely not indicative of a trend reversal.
The drop in Open Interest pointed toward bearish sentiment

Source: Coinglass
In the past week, both the price of SILLY and its Open Interest has been trending downward. The inference was that market participants were unwilling to bet on a bullish near-term outcome for the token.
Realistic or not, here’s SILLY’s market cap in BTC’s terms
The strong sign of short-term bearish sentiment reinforced the chances that SILLY would continue its downtrend. To the south, the Fibonacci extension levels marked some potential support levels.
The 23.6% and 61.8% extension levels sat at $0.0361 and $0.00976, and short sellers could use these levels to take profits.
Disclaimer: The information presented does not constitute financial, investment, trading, or other types of advice and is solely the writer’s opinion.


