Analysis

SOL can move sideways in the short term unless these players gain influence over…
Posted:
editors

Disclaimer: The information presented does not constitute financial, investment, trading, or other types of advice and is solely the writer’s opinion
- SOL could witness a fall in the days to come if the bears gain an upper hand in the market
- Investor confidence in SOL dwindled to some extent after witnessing an upside over the past few weeks
Solana [SOL] broke above its recent trading range of $15.29 – $17.45. However, at press time, it was facing a hurdle at $24.45. It was trading at $23.65 and flickered red, indicating that bears were on site at the time of writing.
Bitcoin [BTC] also faced a short-term price rejection at $20,995 during the same period. Therefore, SOL could oscillate in a new trading range and attempt a retest at the $23.45 level.
Read Solana’s [SOL] Price Prediction 2023-24
SOL’s next short-term trading range
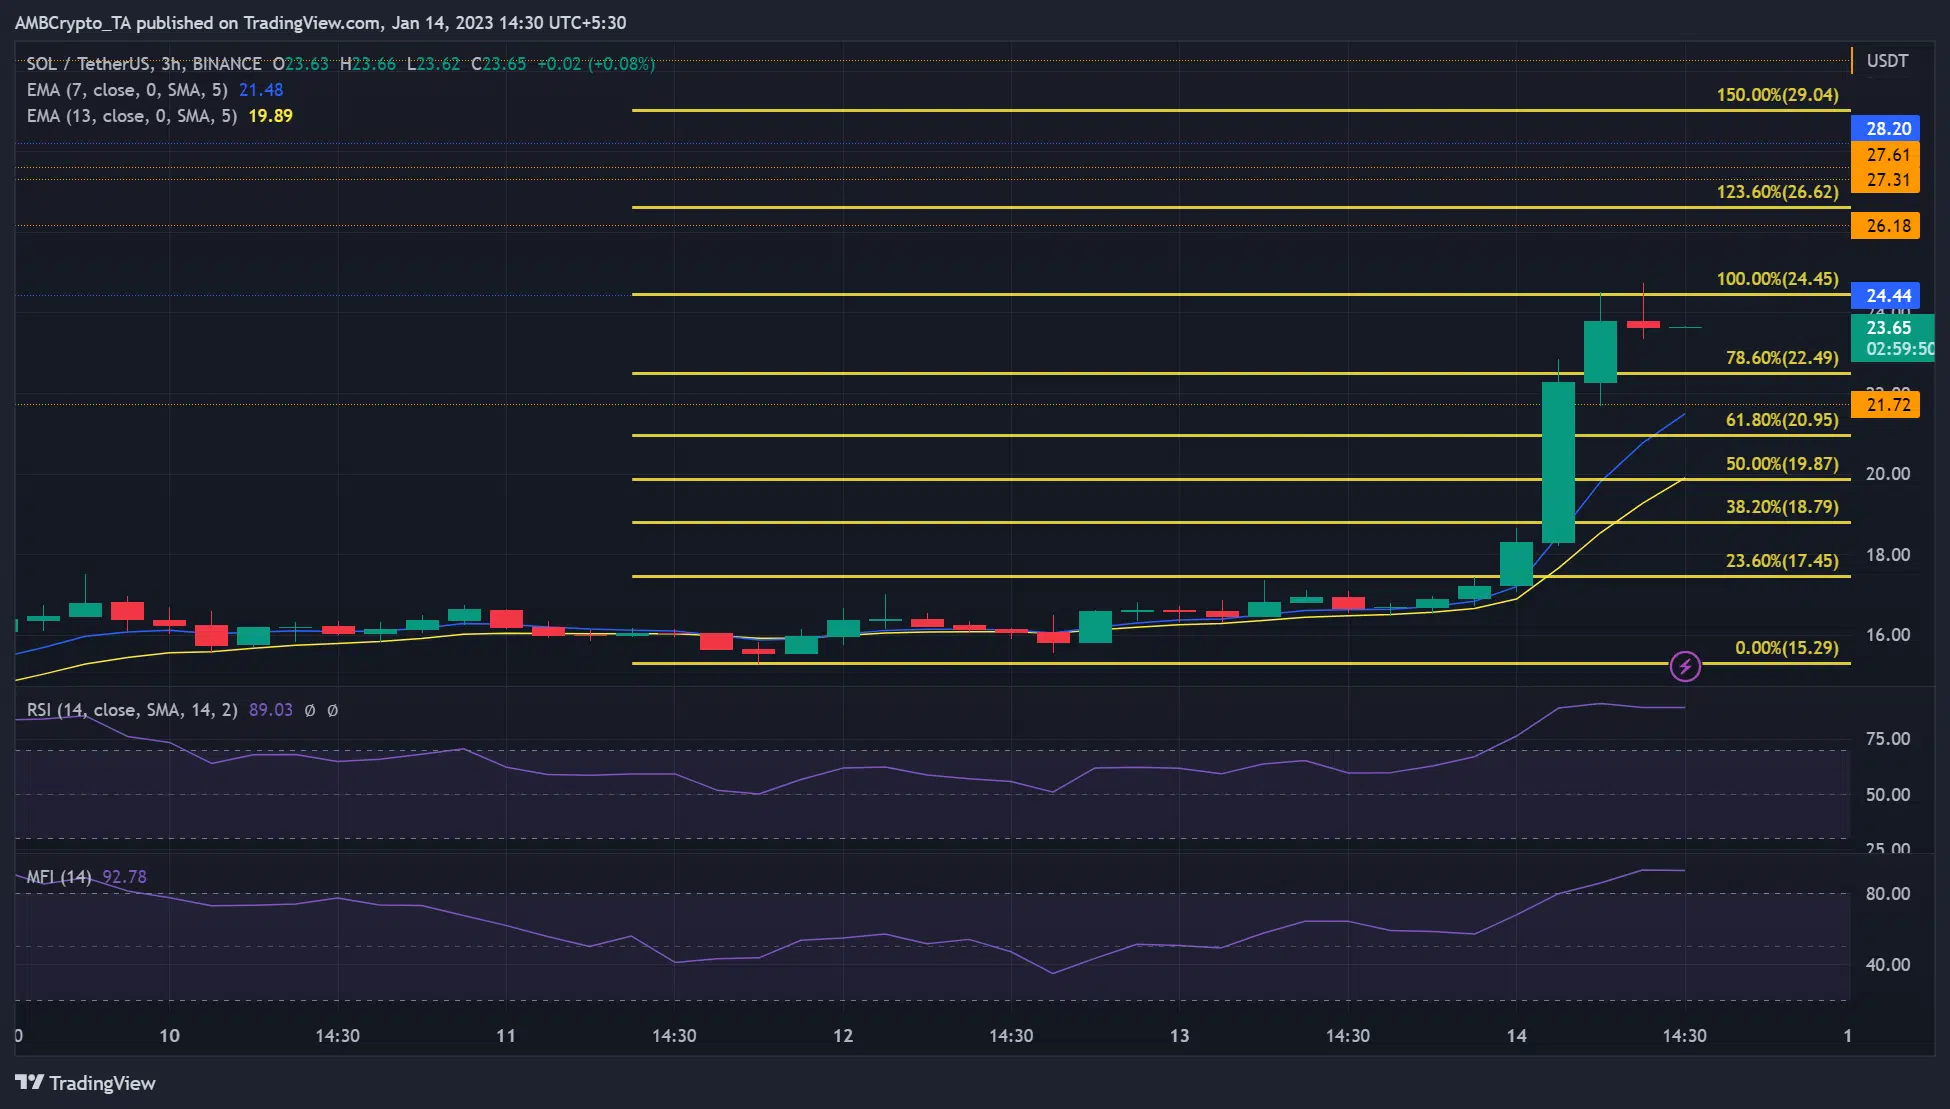
Source: SOL/USDT on TradingView
At press time, SOL’s Relative Strength Index (RSI) and Money Flow Index (MFI) were flat on the three-hour chart. It implies that buying pressure stagnated and could face a reversal if bears gained more influence.
At the same time, the RSI and MFI were in the overbought zone, indicating that the bullish momentum was still relatively strong at press time. Therefore, SOL could retest the $24.45 level and oscillate between $21.72 – $24.45 in the next few hours.
SOL bulls may only attempt a break above this range if BTC overcomes the $20,995 short-term resistance.
Is your portfolio green? Check out the SOL Profit Calculator
Alternatively, bears could push SOL below $21.72 if selling pressure intensifies. However, such a downtrend could find steady support on the 61.8% Fib level of $20.95 and invalidate the bullish bias described above.
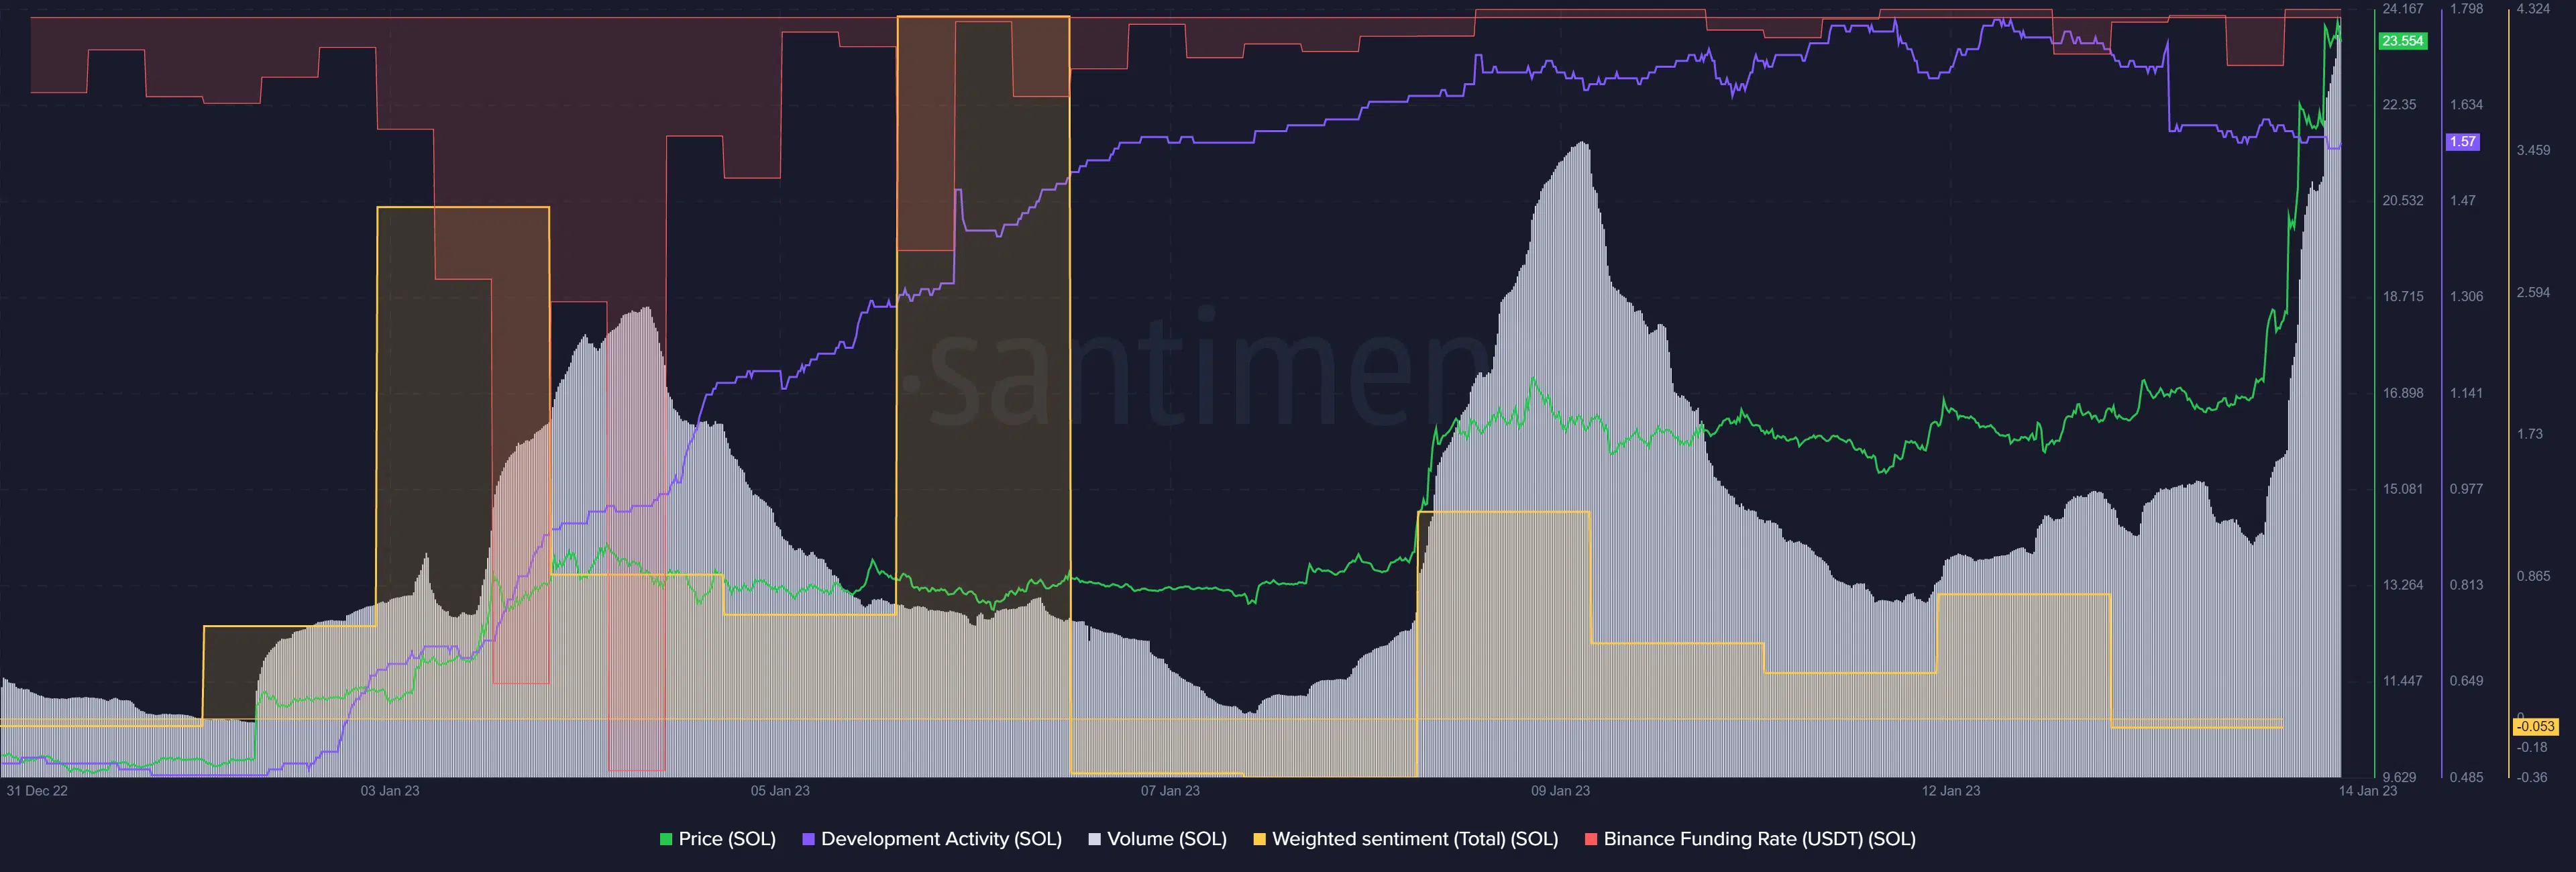
SOL’s trading volume surged, but sentiment and development activity declined
Source: Santiment
According to Santiment, SOL’s development activity declined slightly after witnessing massive growth over the past few days. Similarly, its total weighted sentiment retreated from the positive side and was hanging below the neutral line, the negative side.
This showed that investors’ confidence in the asset dropped slightly after the decline in development activity.
However, SOL’s trading volume and prices surged alongside an increasing demand in the derivatives market, as evidenced by Binance Funding Rate moving into the positive zone.
These two positive metrics show a possible uptrend momentum, while a decline in development activity and sentiment could cancel out the momentum. Thus, BTC performance could offer a much more accurate direction for SOL’s next price action.