


Disclaimer: The information presented does not constitute financial, investment, trading, or other types of advice and is solely the writer’s opinion.
- SOL posted enormous gains over the past two weeks
- Such momentum might not be sustained for very long and could see consolidation or even a pullback
Solana [SOL] saw an increased trade volume as prices sailed to levels not seen since November 2022. A resistance level of $32 from mid-July, as well as the previous November’s high, were the next targets for SOL.
Read Solana’s [SOL] Price Prediction 2023-24
A previous report from AMBCrypto noted that the $30, $32, and $37.4 were the levels of importance for bulls to beat. It also highlighted the $24 level as one that bulls must defend in the long run to sustain the rally.
The strong rally promised further gains for SOL bulls to enjoy
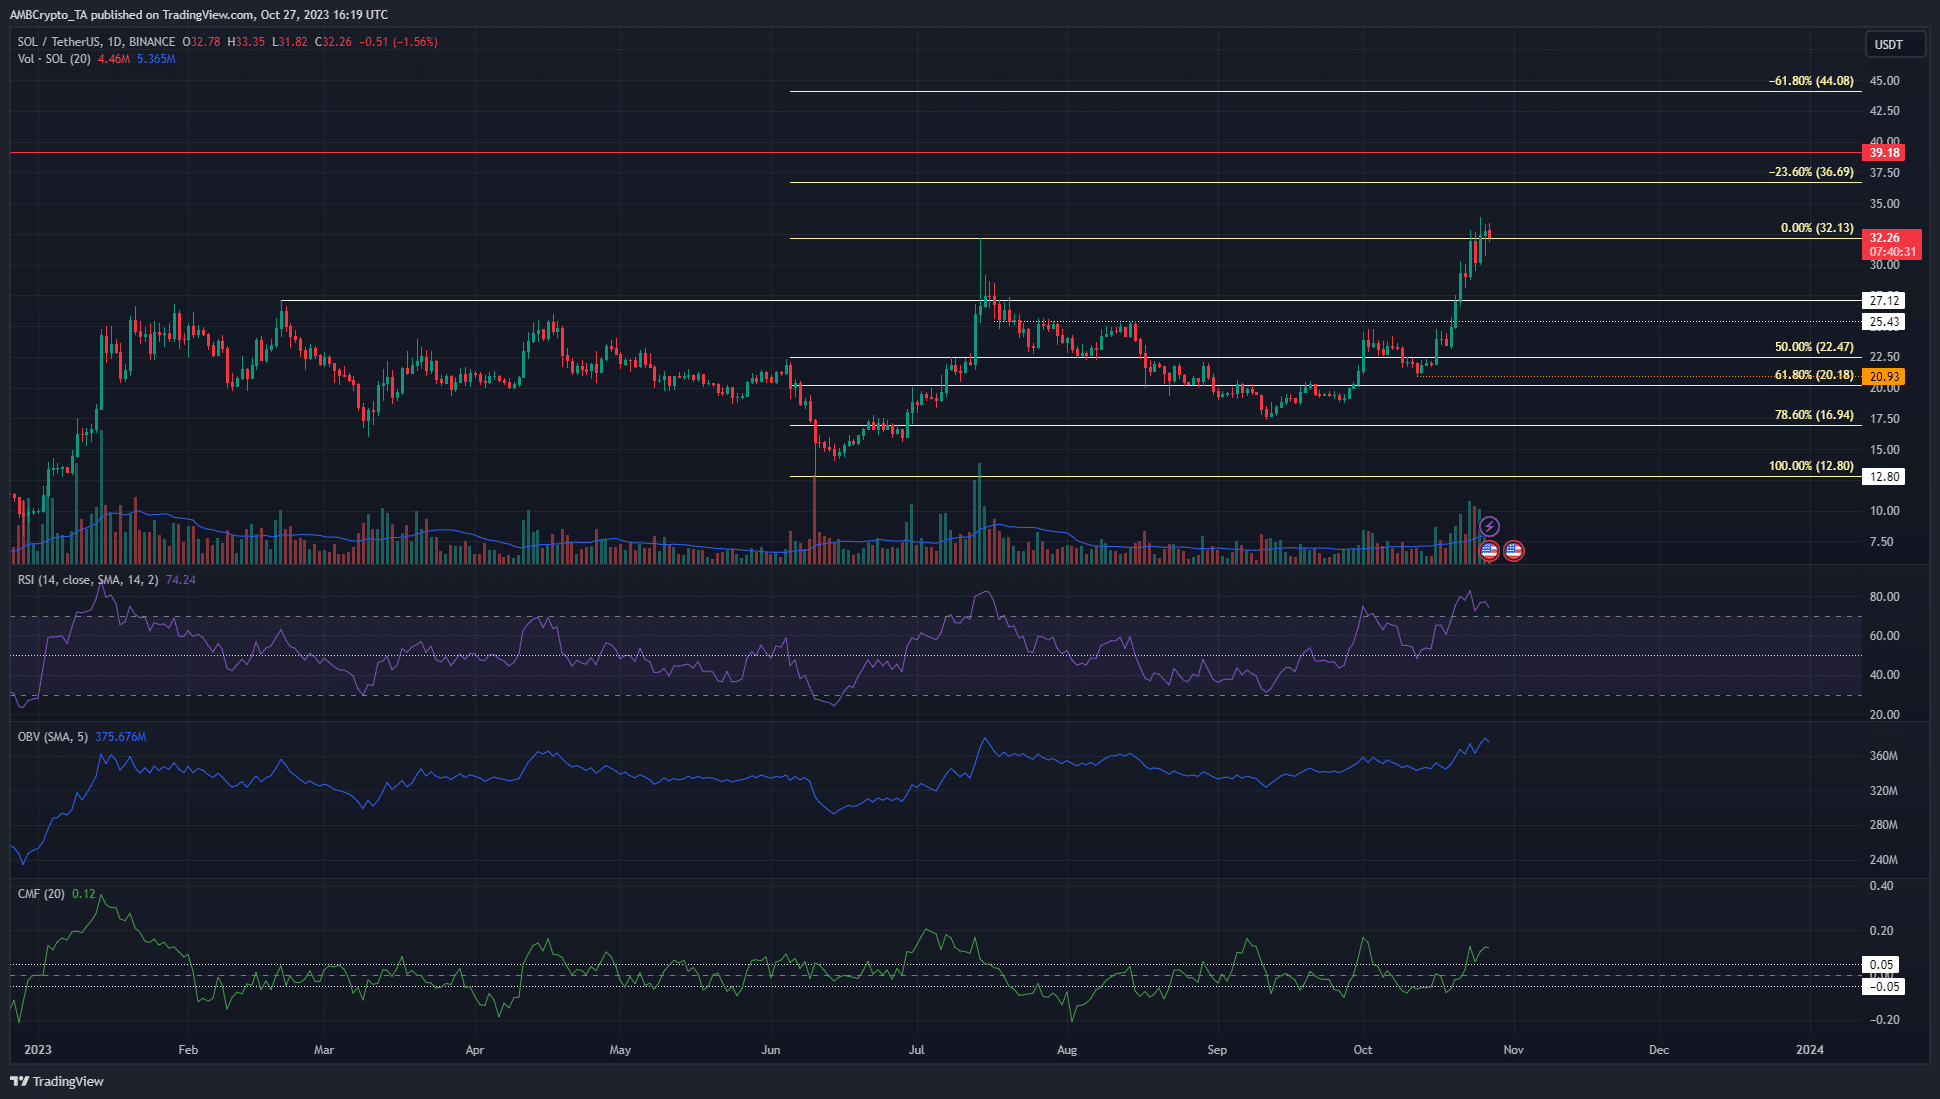
A set of Fibonacci retracement levels (pale yellow) was plotted based on SOL’s rally from $12.8 to $32.13 that occurred in June and July. It showed the 23.6% and 61.8% extension levels were at $36.69 and $44.08.
The $37-$39 zone was particularly important because it was the region where SOL faced resistance in September and November 2022. Therefore, a large amount of sell orders could be present up to $40, making bullish progress strenuous.
The On-Balance Volume (OBV) was in an uptrend and the Chaikin Money Flow (CMF) was above +0.05 to show significant capital inflow. Together they signaled bullish pressure on the daily chart. The market structure was also firmly bullish, and the Relative Strenght Index (RSI) was above 70 to indicate intense upward momentum.
Are things rosy for SOL in the short term as well?

Hyblock data showed that a notable amount of short positions could be liquidated if SOL continued to register gains. Notably, the $32.4 and $34.1 levels would see more than $10 million in liquidations.
However, the Cumulative Liq Levels Delta was not a large figure. This meant that the market needed time to develop a significant amount of liquidity in a certain region as traders struggled to figure out SOL’s next move. This pool of liquidity could then be tagged before a reversal — but the direction of such a move was unclear so far.
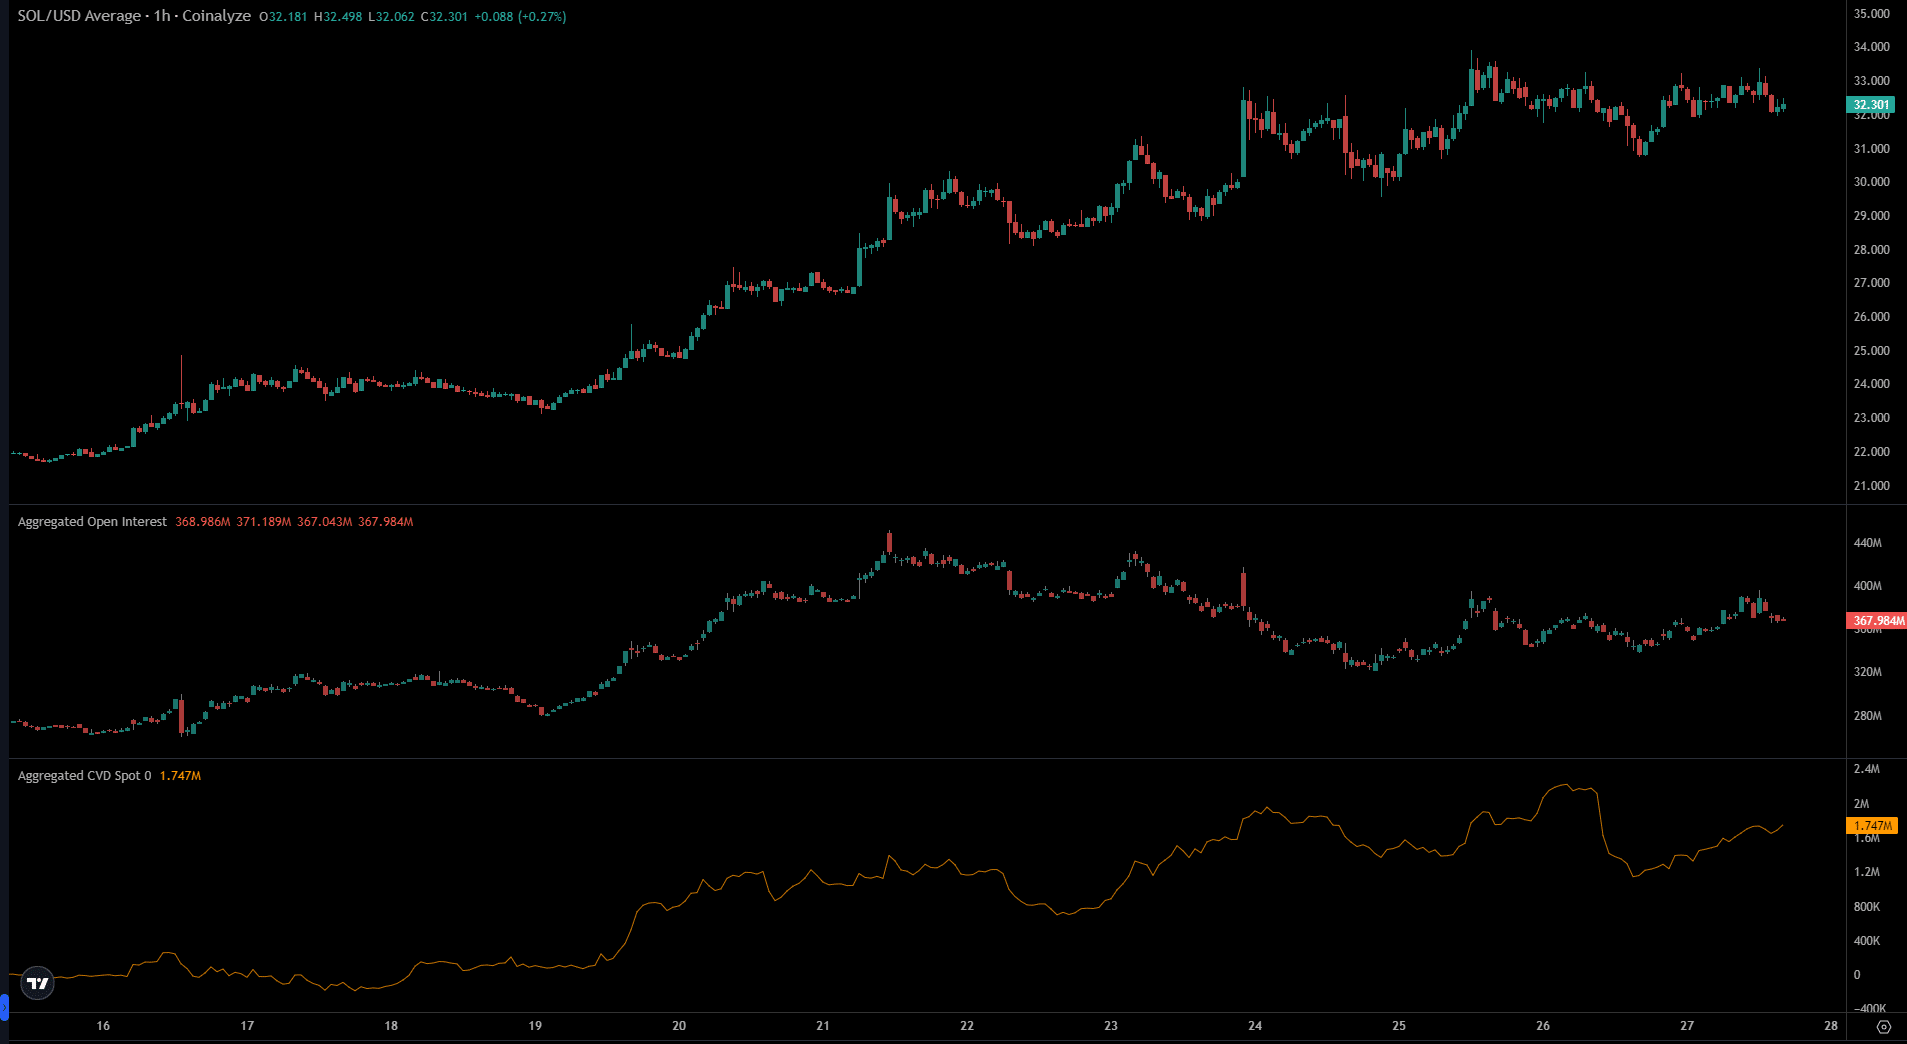
The Open Interest (OI) chart was flat over the past four days. The price of SOL also lacked a short-term trend, so this was not wholly surprising. The inference was subdued conviction, either bullish or bearish, in the market.
Is your portfolio green? Check the Solana Profit Calculator
The spot Cumulative Volume Delta (CVD) also saw ups and downs but lacked a trend over the past few days. These factors suggested SOL could consolidate near the $30 mark in the coming days. Over a longer time horizon such as four to eight weeks, a SOL move to $50 was possible based on the liquidation levels heatmap of the past two years.