Solana trades at pre-FTX levels once again
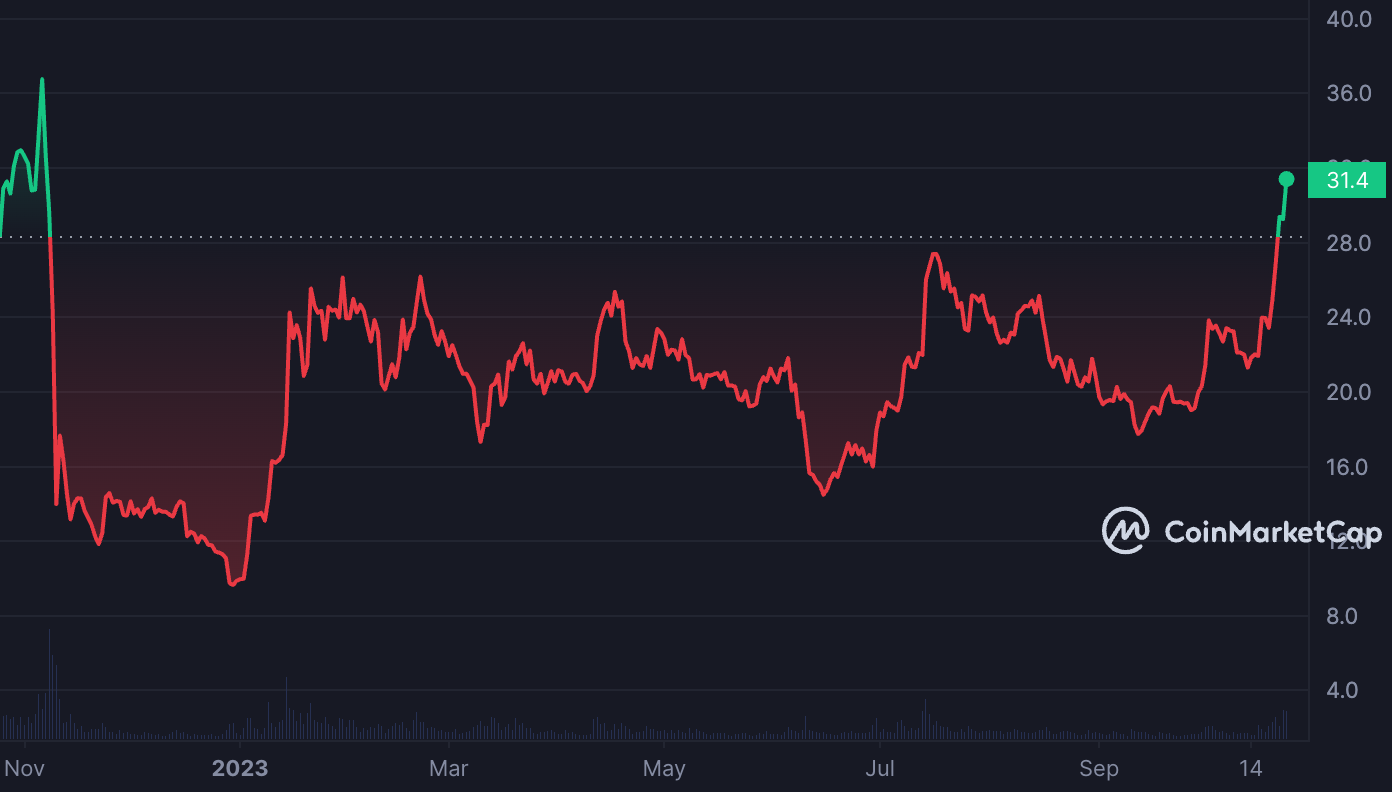
SOL’s value has risen by 63% in the last month. At its press time price, the altcoin traded at levels last observed in November 2022.

- SOL’s price rallied by over 60% in the last 30 days.
- It now trades at its highest price level since November 2022.
Solana [SOL] has seen the most growth among the top ten crypto assets in terms of market capitalization in the last month, with its price surging over 60%, according to data from Messari.
The price of major ecosystem tokens has recently been on the rise.
Solana in particular has experienced a nearly 55% price appreciation over the last 30 days.
Major Ecosystem Screener: https://t.co/TPNhzaeln4 pic.twitter.com/EXbjvQvO79
— Messari (@MessariCrypto) October 23, 2023
Is your portfolio green? Check out the SOL Profit Calculator
This performance comes amid a broader crypto market rebound, with Bitcoin [BTC] and Ethereum [ETH] also seeing gains of 30% and 15%, respectively, during the same period.
Demand for SOL is through the roof
At press time, the price per SOL coin was $32. The last time the altcoin traded at this price level was in November 2022, according to data from CoinMarketCap.
The bullish momentum that has marked the general crypto market in the past few weeks has resulted in a growth in trading activity around SOL. According to data from Santiment, the coin’s daily trading volume has risen by over 30% since 16 October.
At press time, SOL trades worth over $1 billion have been completed in the last 24 hours, marking its highest daily trading volume since July.

Momentum indicators observed on a daily chart revealed that SOL accumulation has significantly outpaced distribution among spot traders.
For example, the coin’s Relative Strength Index (RSI) and Money Flow Index (MFI) were spotted at 76.59 and 87.73, respectively, at the time of writing.
These values suggested that buying activity exceeded profit-taking activity, hence the sustained rally in SOL’s price. However, it should be noted that the values of these indicators also suggested that the alt was overbought and was due for correction.
The coin’s Chaikin Money Flow (CMF) – which measures the buying and selling pressure for a crypto asset – was 0.10 at press time. A positive CMF value is a sign of strength in the market, indicating the inflow of much-needed liquidity.
This is good because the supply of more liquidity makes it easier for spot market buyers and sellers to execute trades at desired prices, potentially reducing price volatility.
How much are 1,10,100 SOLs worth today?
Moreover, SOL’s Average Directional Index confirmed the strength of the current uptrend. At 39.02 at press time, the uptrend was strong. This meant that SOL’s price was moving in a clear direction, and a lot of bullish momentum existed behind the trend.
The Positive Directional Indicator (green) at 40.60 also rested above the Negative Directional Indicator (red) at 5.7. This suggested that the buyers’ strength exceeded the sellers.