SOL traders looking for profit can enter the market at this level

As anticipated in the previous article, Solana (SOL) continued its selling spree in a descending channel towards its five-month support trendline before picking itself up from there.
SOL approached a crucial area of value at the time of writing. Any close above the pattern and the 20 EMA (red) would position SOL for a possible test of the $105-$110 range near its 50 EMA (cyan). Defending the $85-mark would be vital to induce a change in the current trend and prevent a further downfall. At press time, SOL traded at $90.2235.
SOL Daily Chart
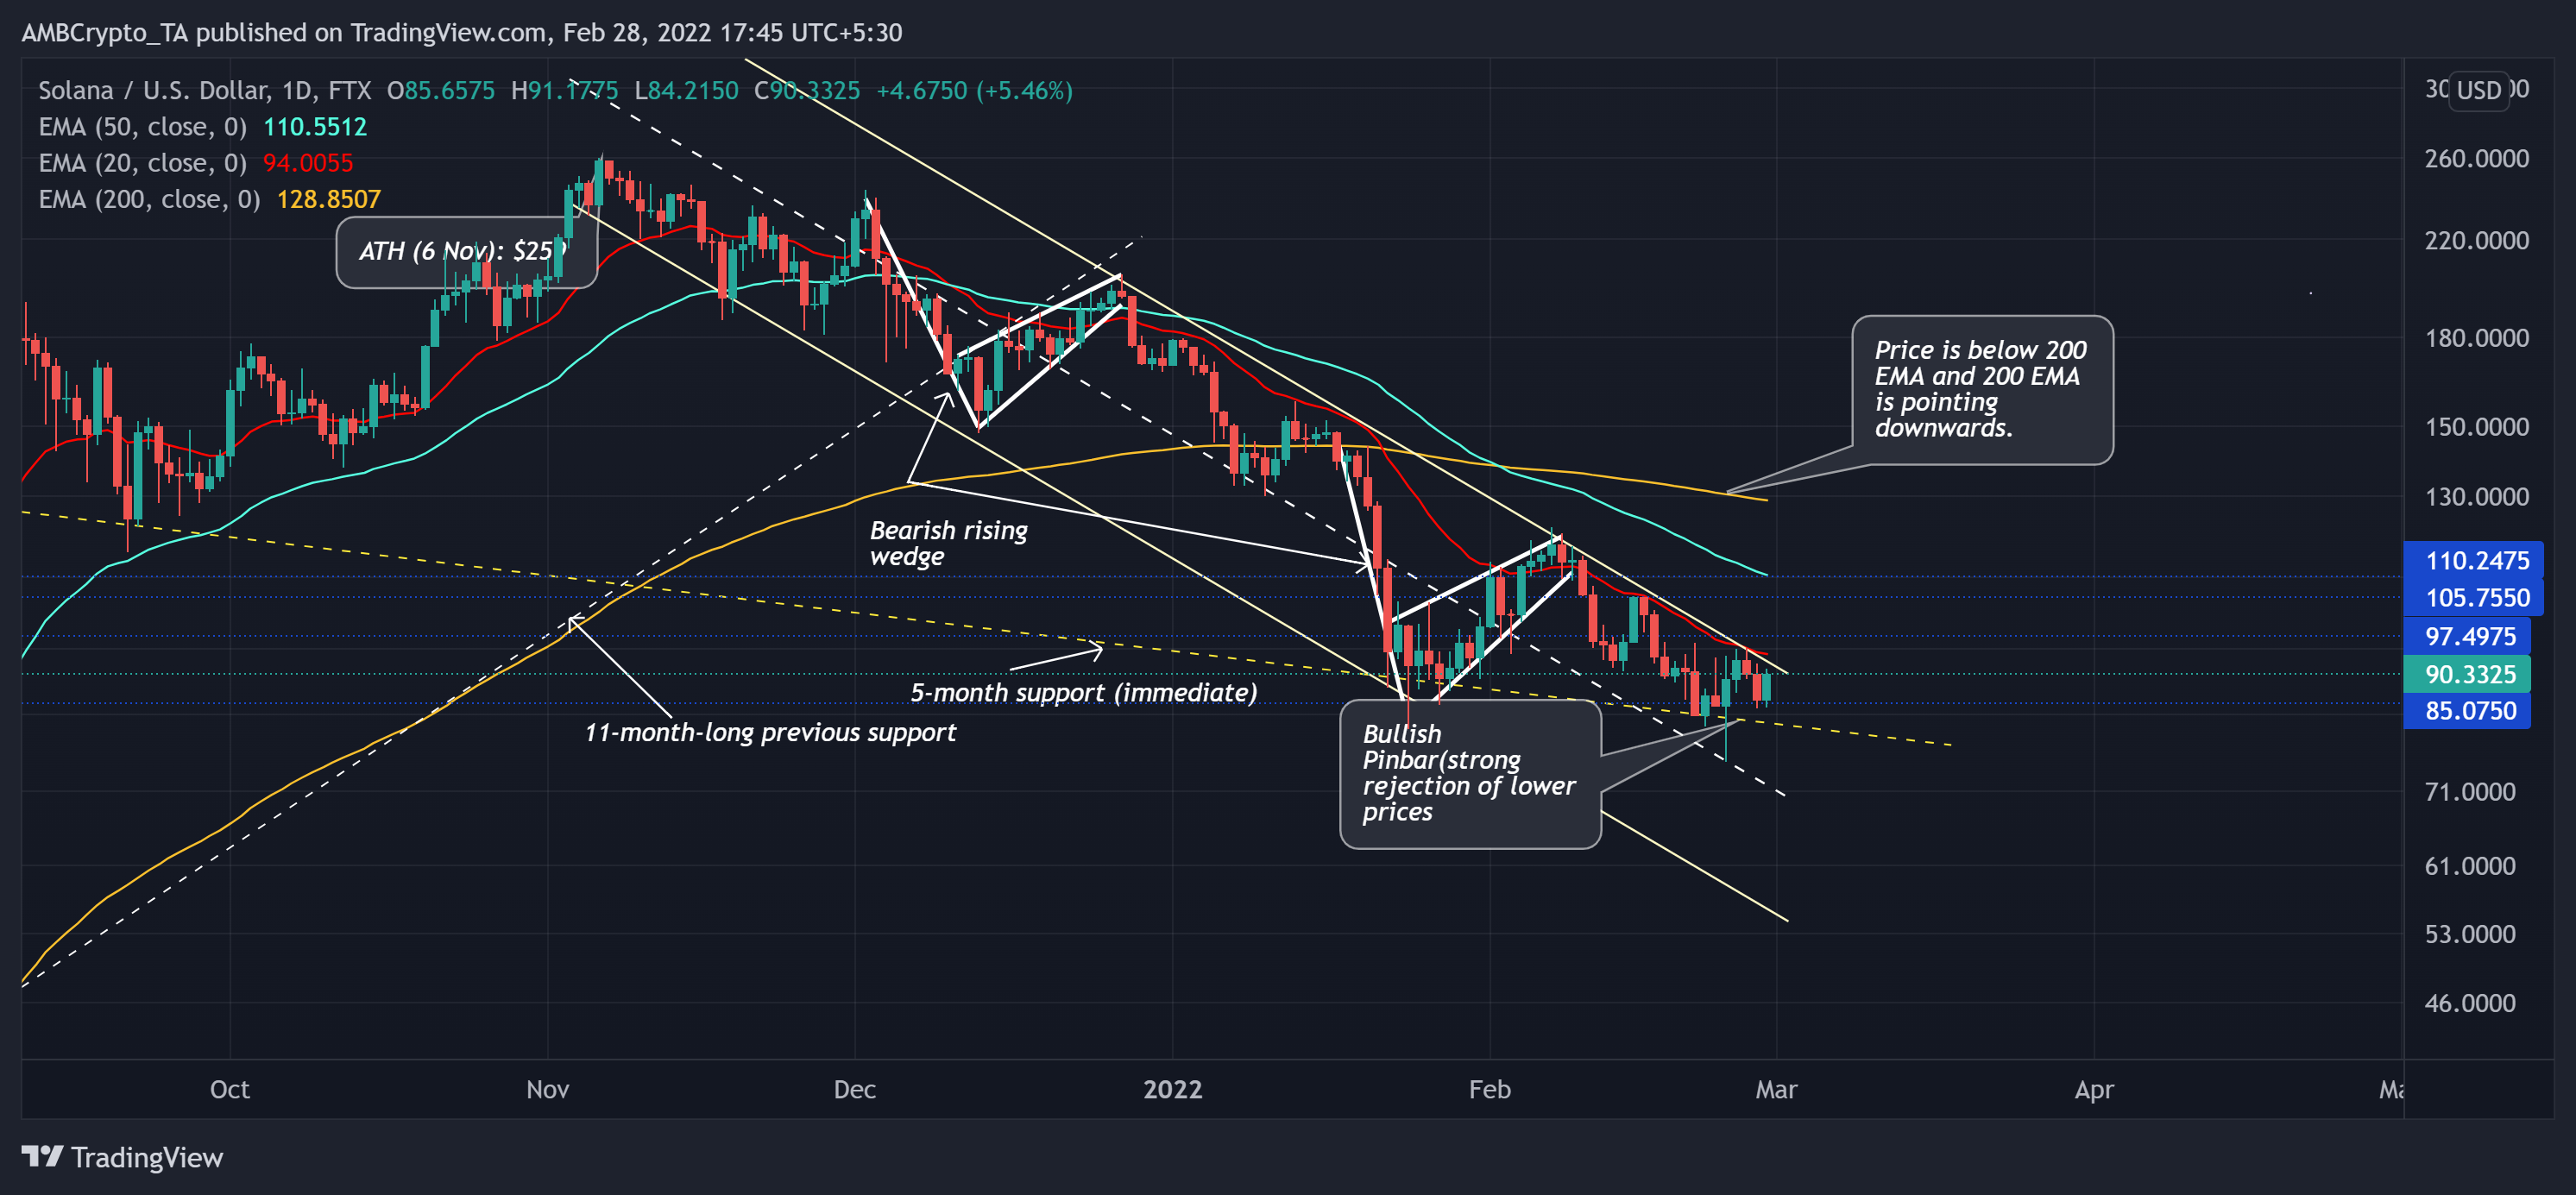
The recent bearish phase saw a whopping 71% retracement as it pierced through vital price points while forming two bearish flags in the last three months. As a result, the price action fell below its 200 EMA (yellow). Thus, revealing a likely start of a long-term downtrend. On top of it, SOL hit its six-month low on 24 February.
During this phase, the near-term EMA’s fell below the 200 EMA. Also, the distance between 20 and 50 EMA has almost overstretched after the current losses. Thus, a potential bullish comeback in the days to come could be conceivable as the distance between these lines lessens.
Also, over the past five days, SOl has displayed a strong rejection of lower prices as it approached its six-month support at the $85-level. Accordingly, it witnessed a bullish pin bar that reaffirmed the bullish intentions.
A close above the upper trendline of the down-channel would be a strong trigger point for entering into a buy position, while SOL would eye to test the $105-mark before a possible pullback. Should the bulls dwindle, a restest of the five-month support (dashed, yellow) before touching the aforementioned levels shouldn’t surprise the investors/traders.
Rationale

The RSI’s patterned breakout could find resistance at the 46-point before a midline test which could open up a recovery window for the bulls. The bulls need to capitalize on this momentum to finally overturn its long-term resistance at the 20 EMA.
Furthermore, MACD histogram was in a tight phase and would most likely take a volatile stand in the days to come. Although its lines displayed a bullish edge, they needed to approach the midline to reaffirm a strong position.
Conclusion
A strong confluence is observed after looking at the willingness of the buyers to step in at the $85-support. Any close above the $94-mark would brighten the possibilities of a restest of the $105 mark.
Besides, considering the impact of the broader sentiment of Bitcoin’s movement would also be vital in making a profitable move.