Solana $160 resistance rejected – Will SOL slide right down to $120?
In the short-term, Solana could bounce off the $141 support level , but long-term gains seem unlikely.
- Solana did not see heightened buying pressure during its month-long range consolidation.
- The rejection at $160 underlined how crucial that resistance level has been in recent weeks.
Solana [SOL] was forced to retreat from the $160 resistance region again.
An earlier report by AMBCrypto noted that SOL would likely fall back within the month-long range unless prices could flip the $165-$170 region to support.
Another report noted that the on-chain activity was also receding. In turn, this reflected reduced usage and demand for SOL. Hence, traders can expect the current consolidation to continue.
Will the range high rejection see the lows revisited?
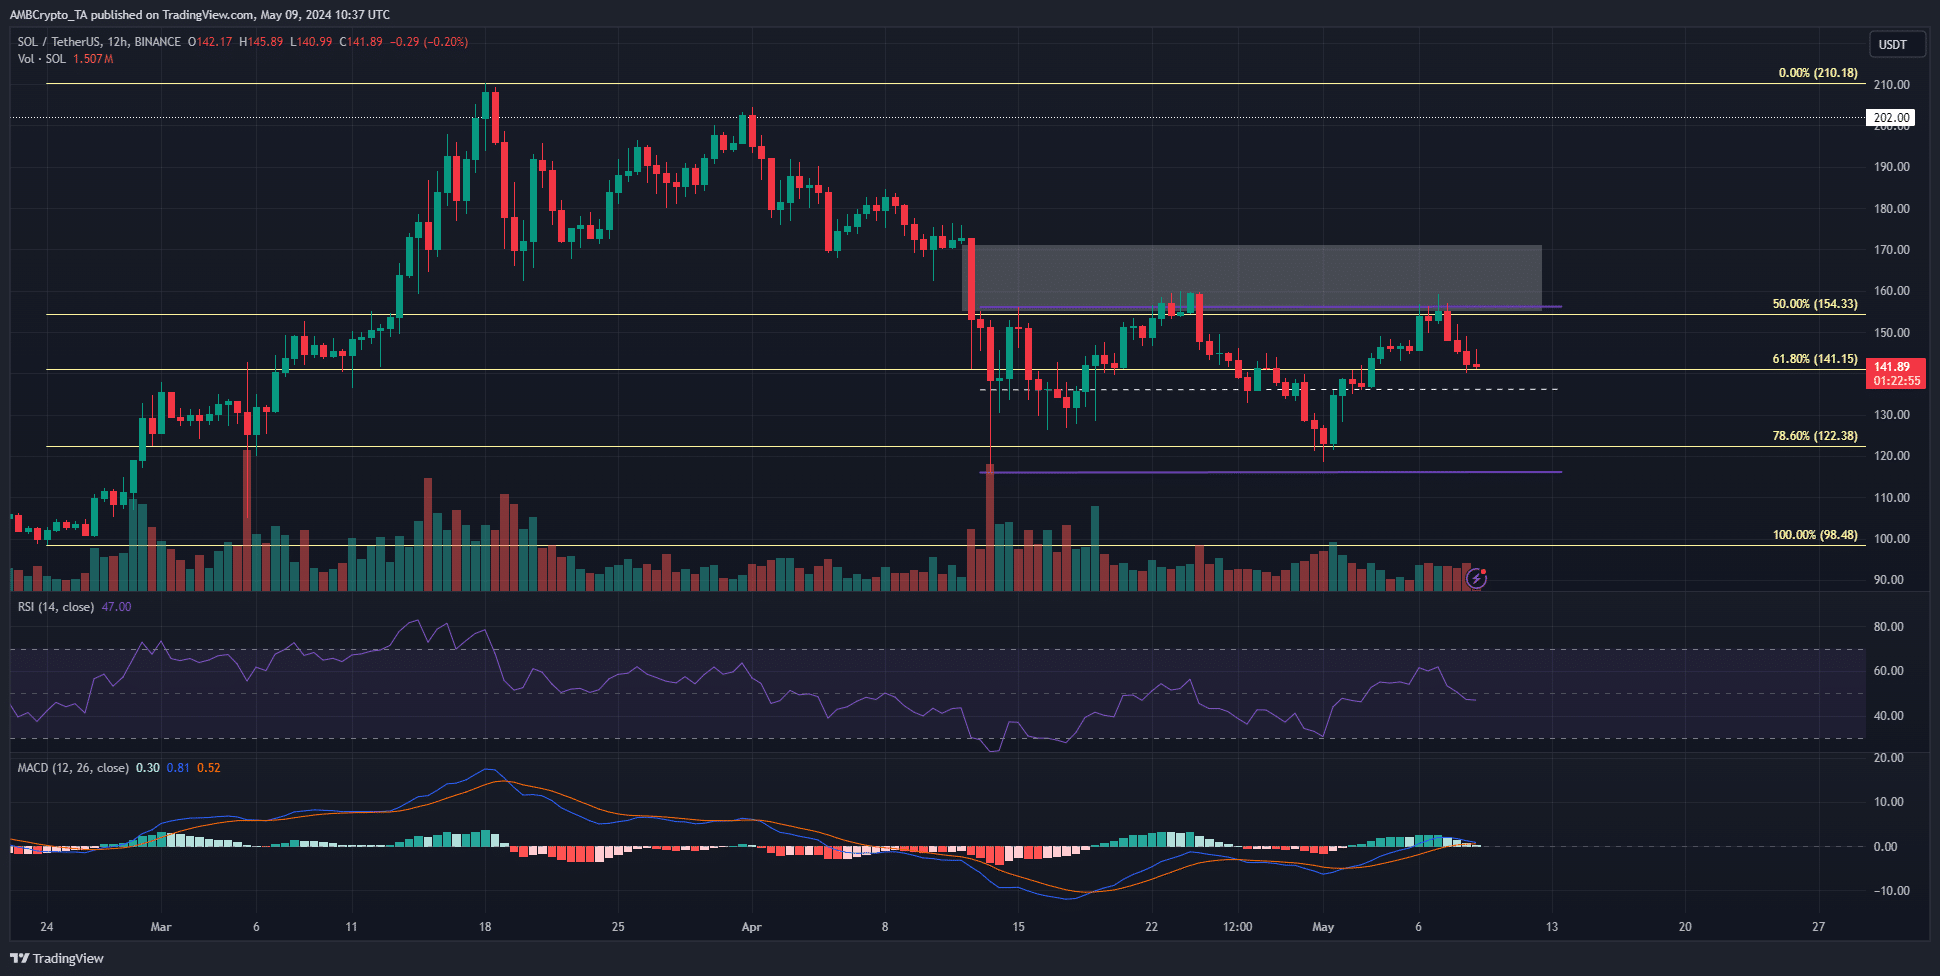
The range (purple) from $156 to $116 has its mid-point at $136. Additionally, the Fibonacci retracement levels at $141 and $122 are also expected to act as support.
The rejection on Monday the 6th of May was followed by a 10.8% drop.
At press time, the $141 level held as support, but it was unclear if it could hold the bears off for the remainder of the week.
The RSI on the 12-hour chart has slipped below neutral 50 as an early indication of growing bearish momentum.
The MACD showed bullish momentum had been gathering strength, but it was quickly reversed in the past 48 hours. At press time, the MACD was neutral but threatened to flip bearishly.
Traders can expect a minor relief bounce at the $136 mid-range support. The trading volume has remained steadily low in the past two weeks, and if it continues, another drop to the $122 level would be likely.
Speculative activity grinds to a halt
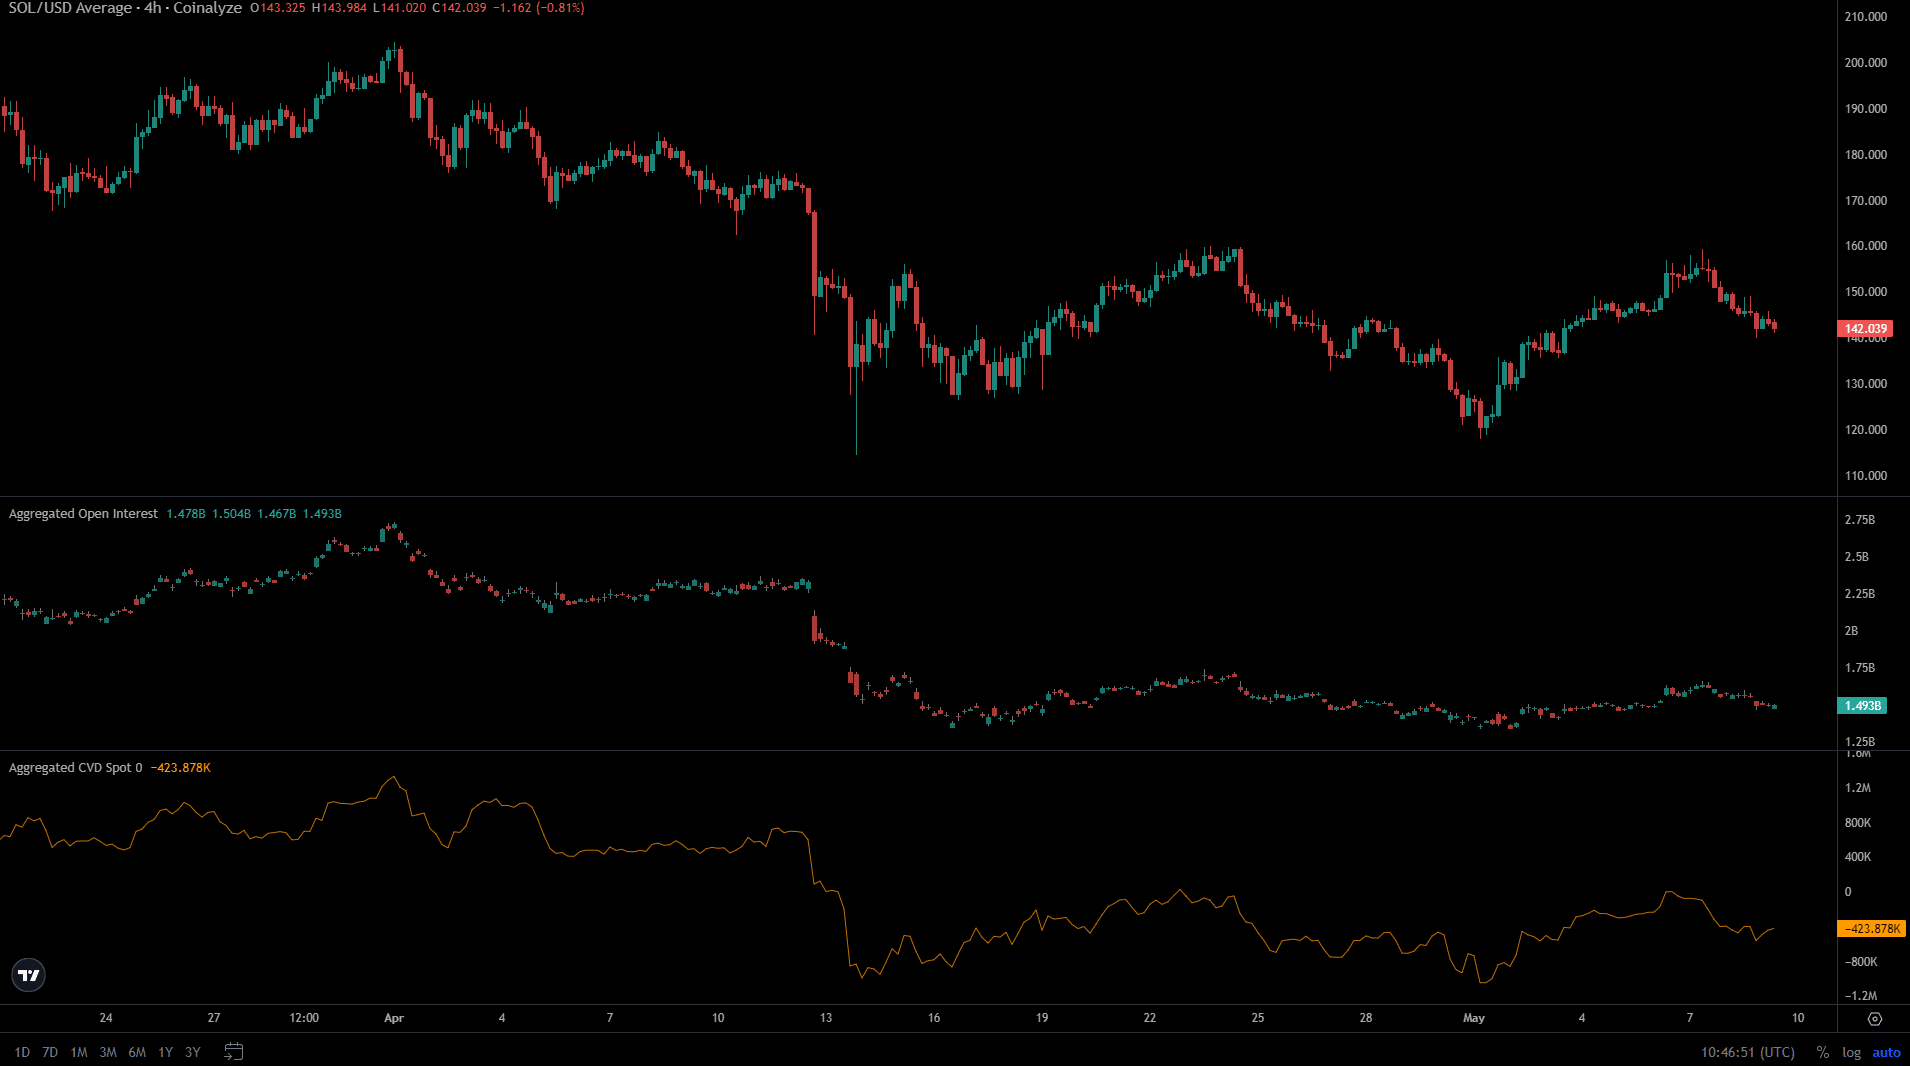
While the price of Solana formed a range in the past month, the Open Interest stayed relatively flat. It saw minor dips and bounces alongside the price oscillation between the range extremes.
This indicated a lack of bullish conviction from futures market participants.
Realistic or not, here’s SOL’s market cap in BTC’s terms
The spot CVD also formed a range. This was a positive finding for long-term bulls, as it underlines a period of consolidation. Ideally, buyers want to see the spot CVD trend higher during consolidation.
Given the uncertainty and fear in the market now, it’s good enough that the spot CVD did not begin a downtrend.
Disclaimer: The information presented does not constitute financial, investment, trading, or other types of advice and is solely the writer’s opinion.


