Solana, Bitcoin Cash, Tron Price Analysis: 8 December

The post effects of the recent bearish move on record-high trading volumes visibly affected the overall trend. As a result, Solana, Bitcoin Cash, and Tron grappled with the 38.2% Fibonacci level.
After hitting their multi-month lows on 3 December, these cryptos have shown recovery signs but need to gather more volumes to turn the tide in their favor.
Solana (SOL)
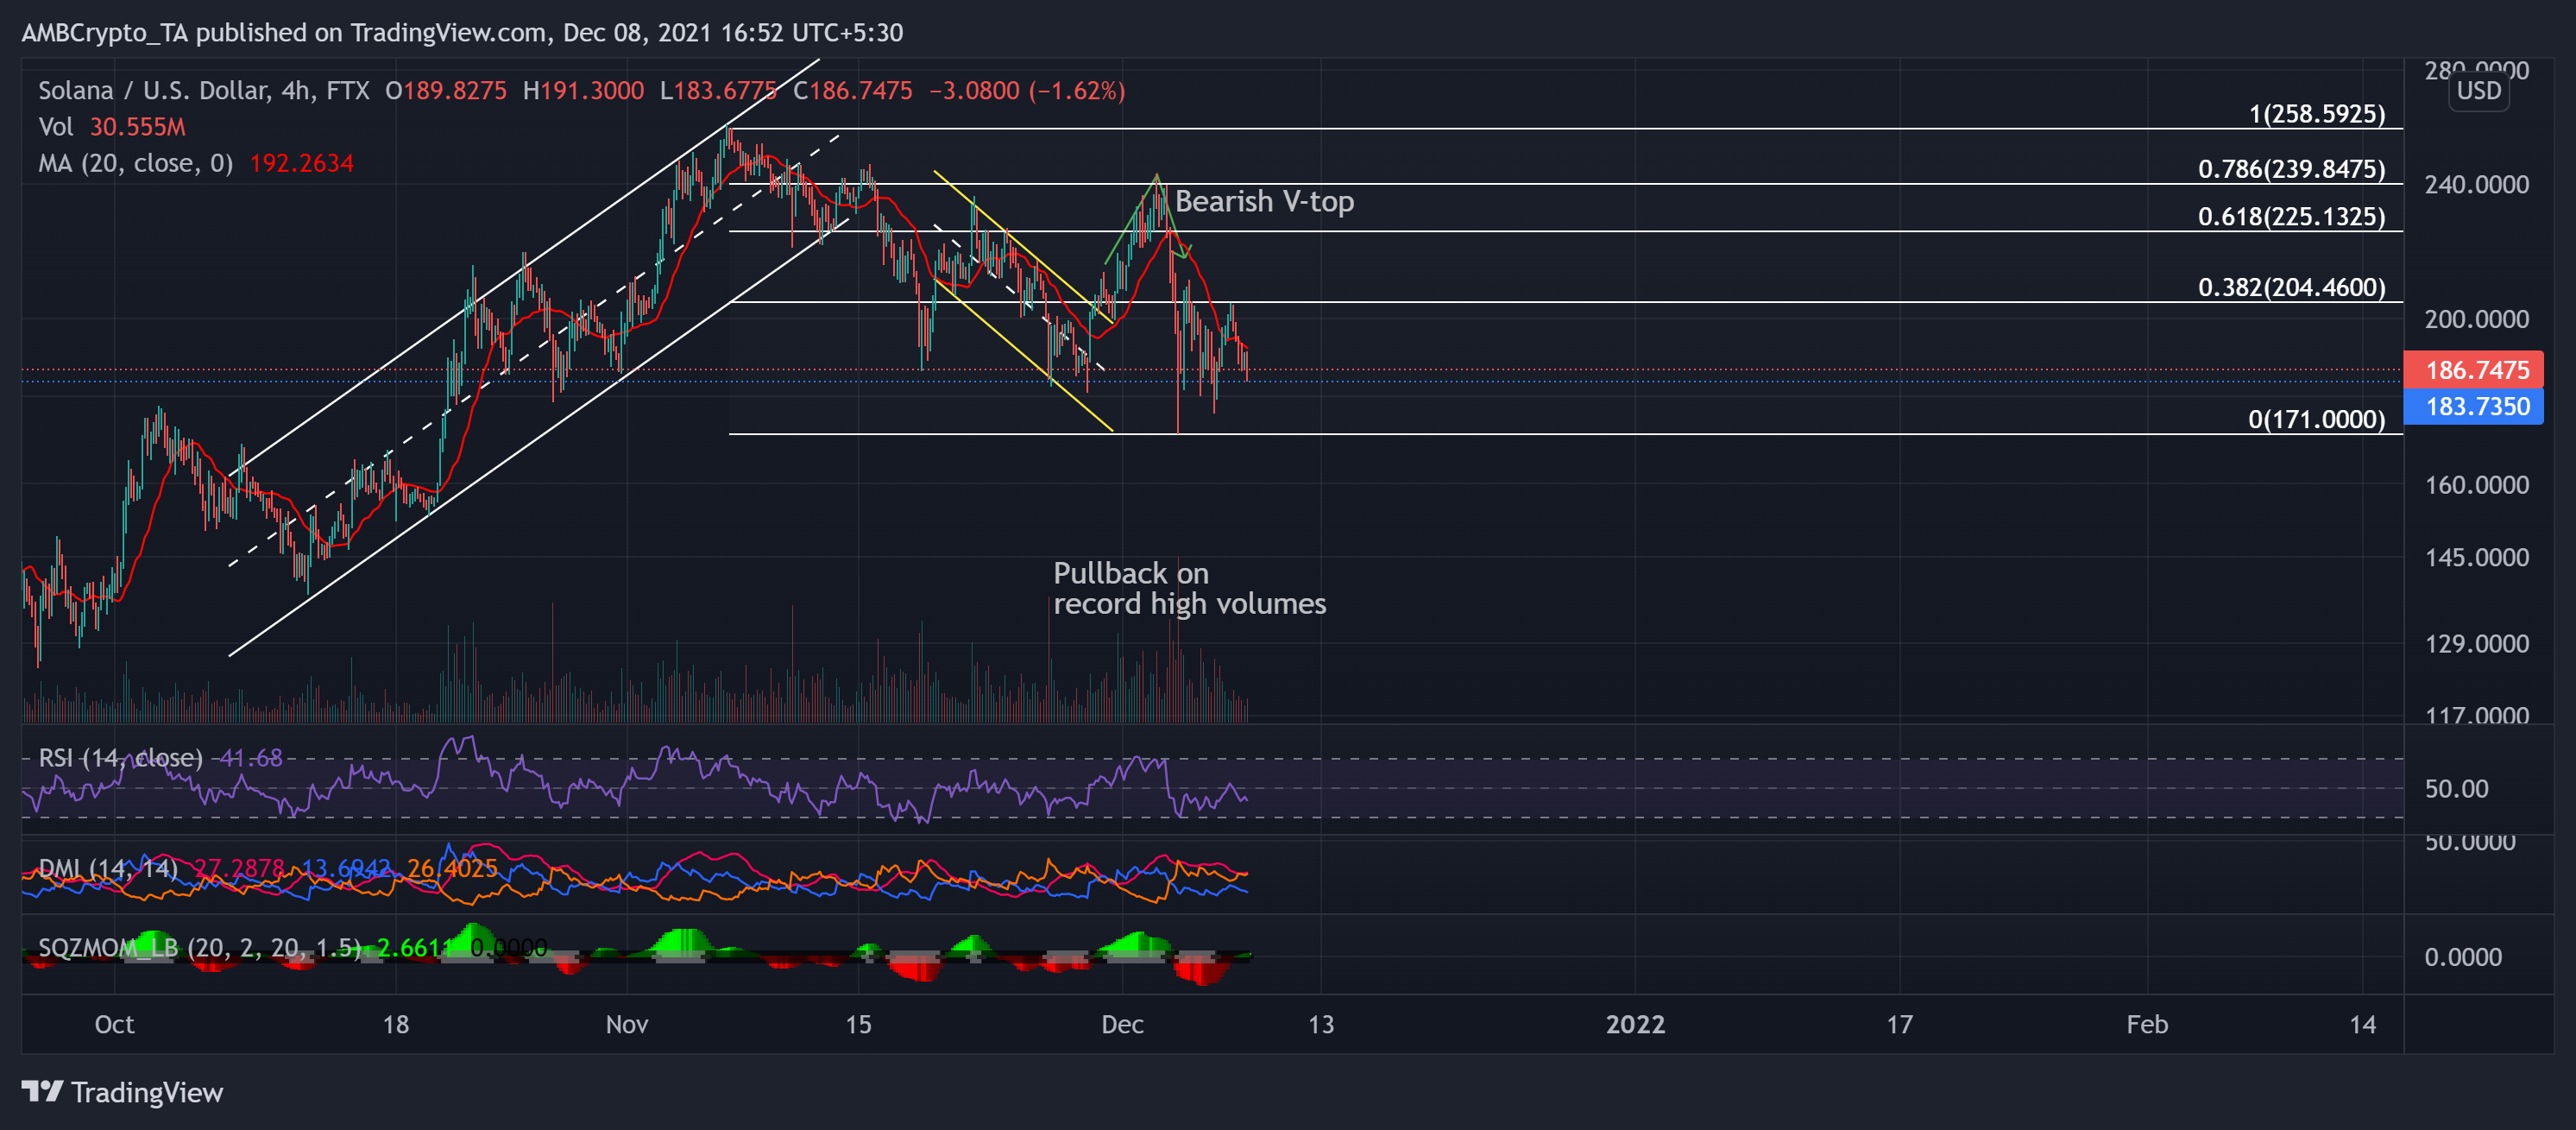
SOL lost nearly 32.6% (from 6 November) of its value as the price poked its six-week low on 3 December.
Post a down-channel breakout on 29 November, bulls breached the 38.2% Fibonacci resistance but could not sustain their pressure. The immediate pullback marked a bearish V-top, after which the price swiftly breached the six-week support at the $183-mark. But gradually, the bulls ensured that level as the immediate support.
At press time, SOL traded at $186.75 after noting an 8.8% 24-hour loss. The RSI was southbound and could not cross the midline in the past five days. Further, the DMI depicted a momentum favoring the bears. Nevertheless, the Squeeze Momentum Indicator displayed black dots, indicating a possible squeeze phase with low near-term volatility.
Bitcoin Cash (BCH)
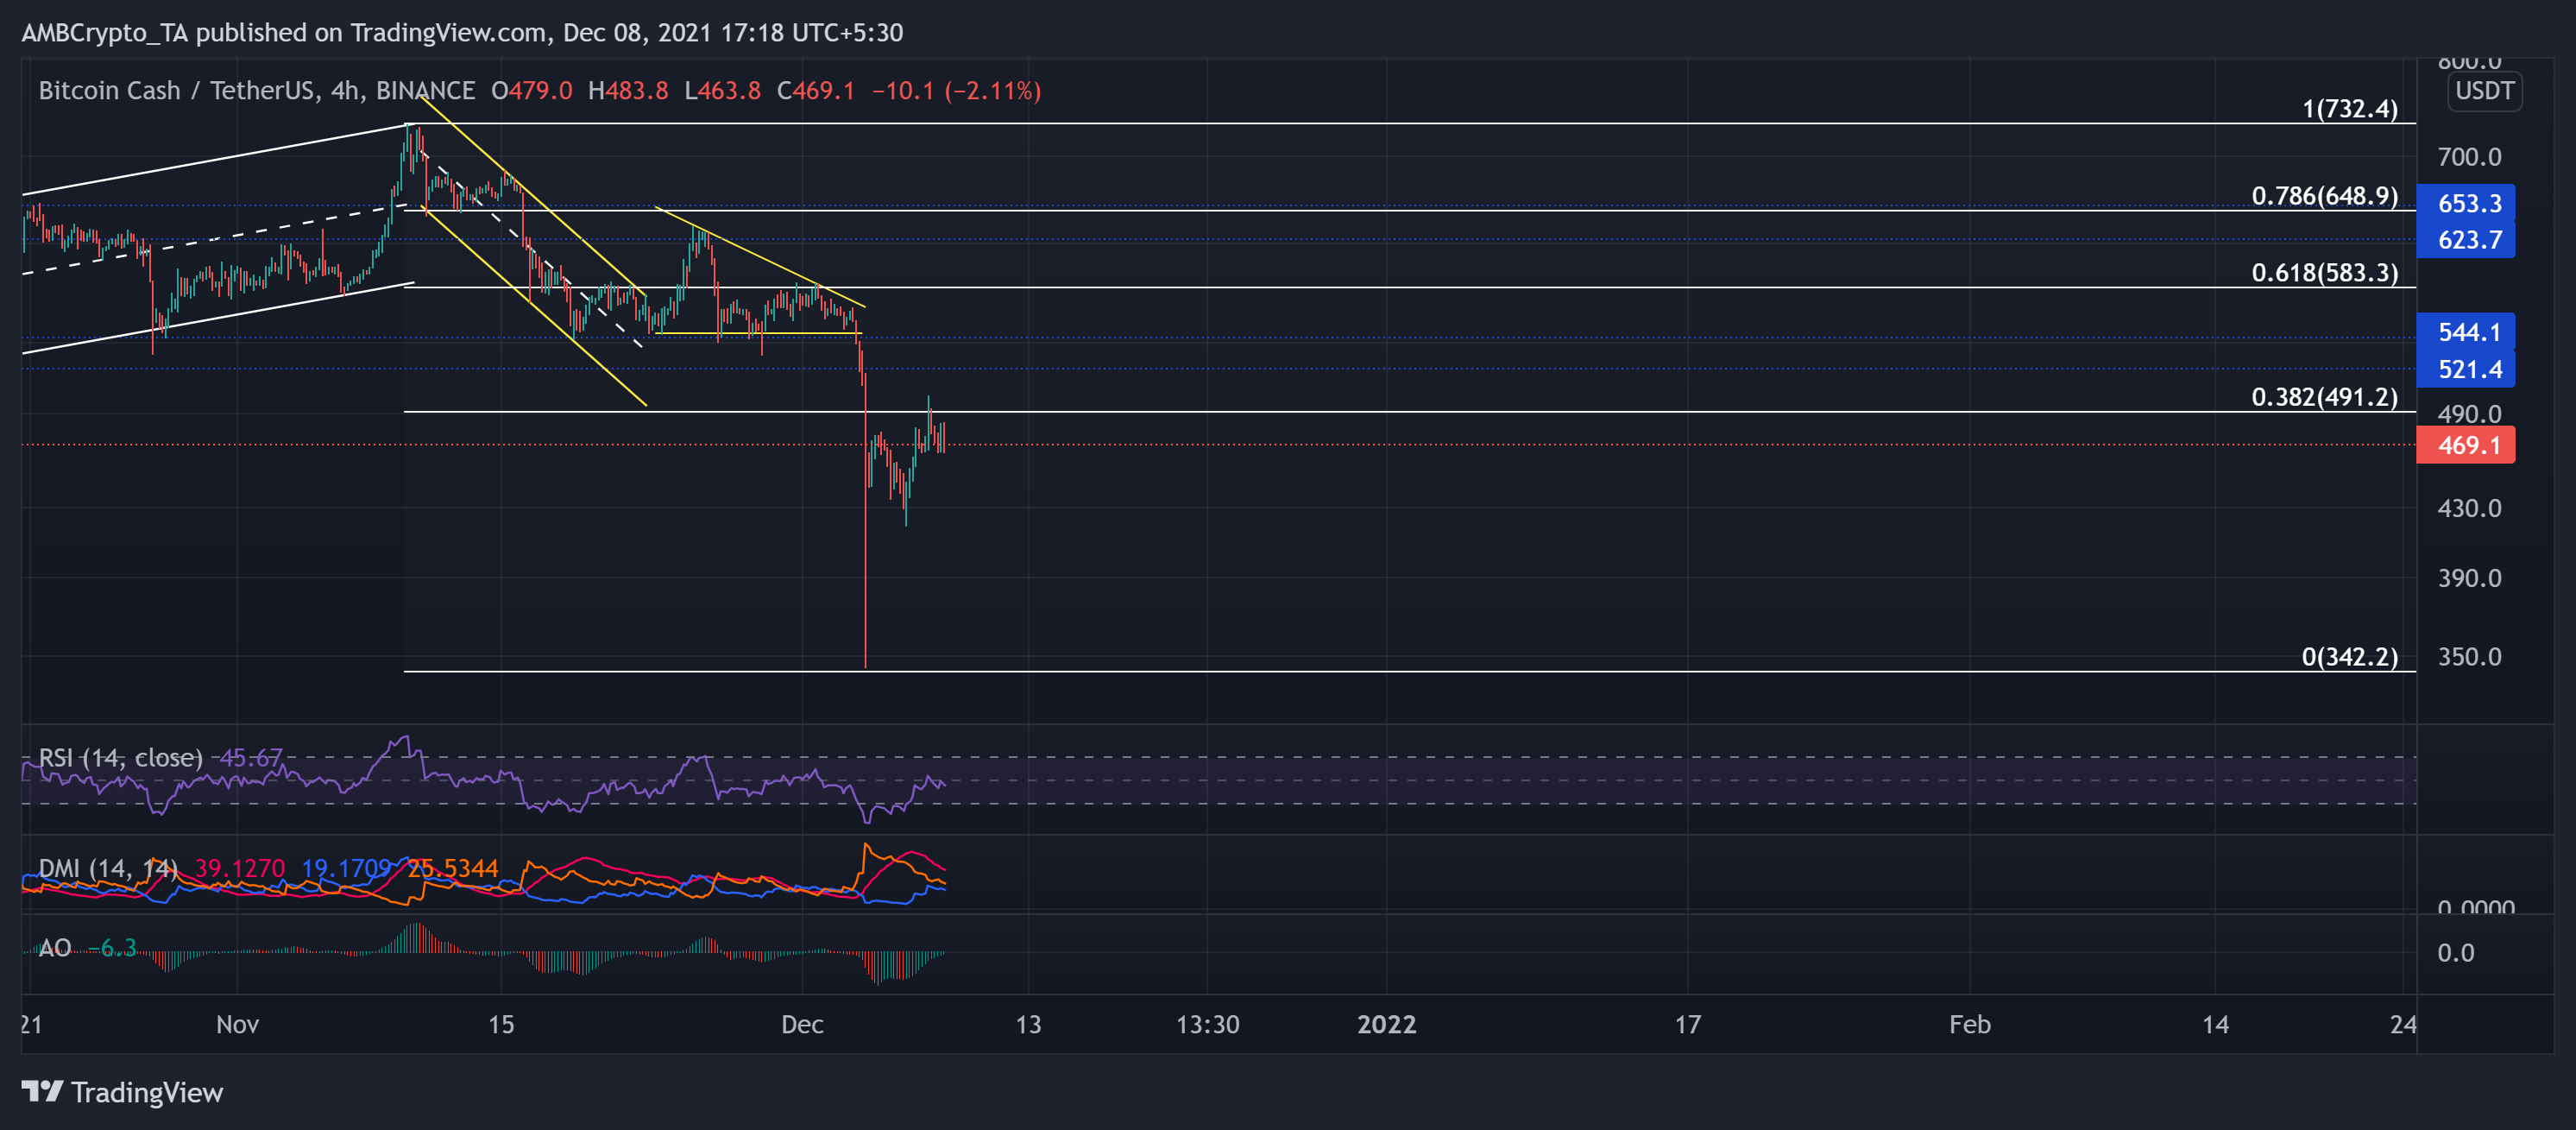
BCH poked its one-week high on 10 November after an impressive October run. Then, corresponding with the broader trend, it marked lower lows in a descending channel (yellow). After a 13.7% down-channel breakout, BCH continually fell and formed a descending triangle (yellow) in its 4-hour chart.
After retesting the $544-mark support for nearly two months, finally, the bears were able to invalidate the long-term bullish trend and turn the tide in their favor. This downturn bolstered a descending triangle breakout as the alt touched its 11-month low on 3 December. At press time, BCH traded at $469.1.
After the RSI hit its record low on 3 December, it saw a decent revival but failed to cross the midline. Also, the DMI hinted at a slight bearish preference. As the bulls tried to trigger an uptrend on 6 December, they could not cross the 38.2% Fibonacci. The AO projected this rally by showing increased bullish momentum.
Tron (TRX)
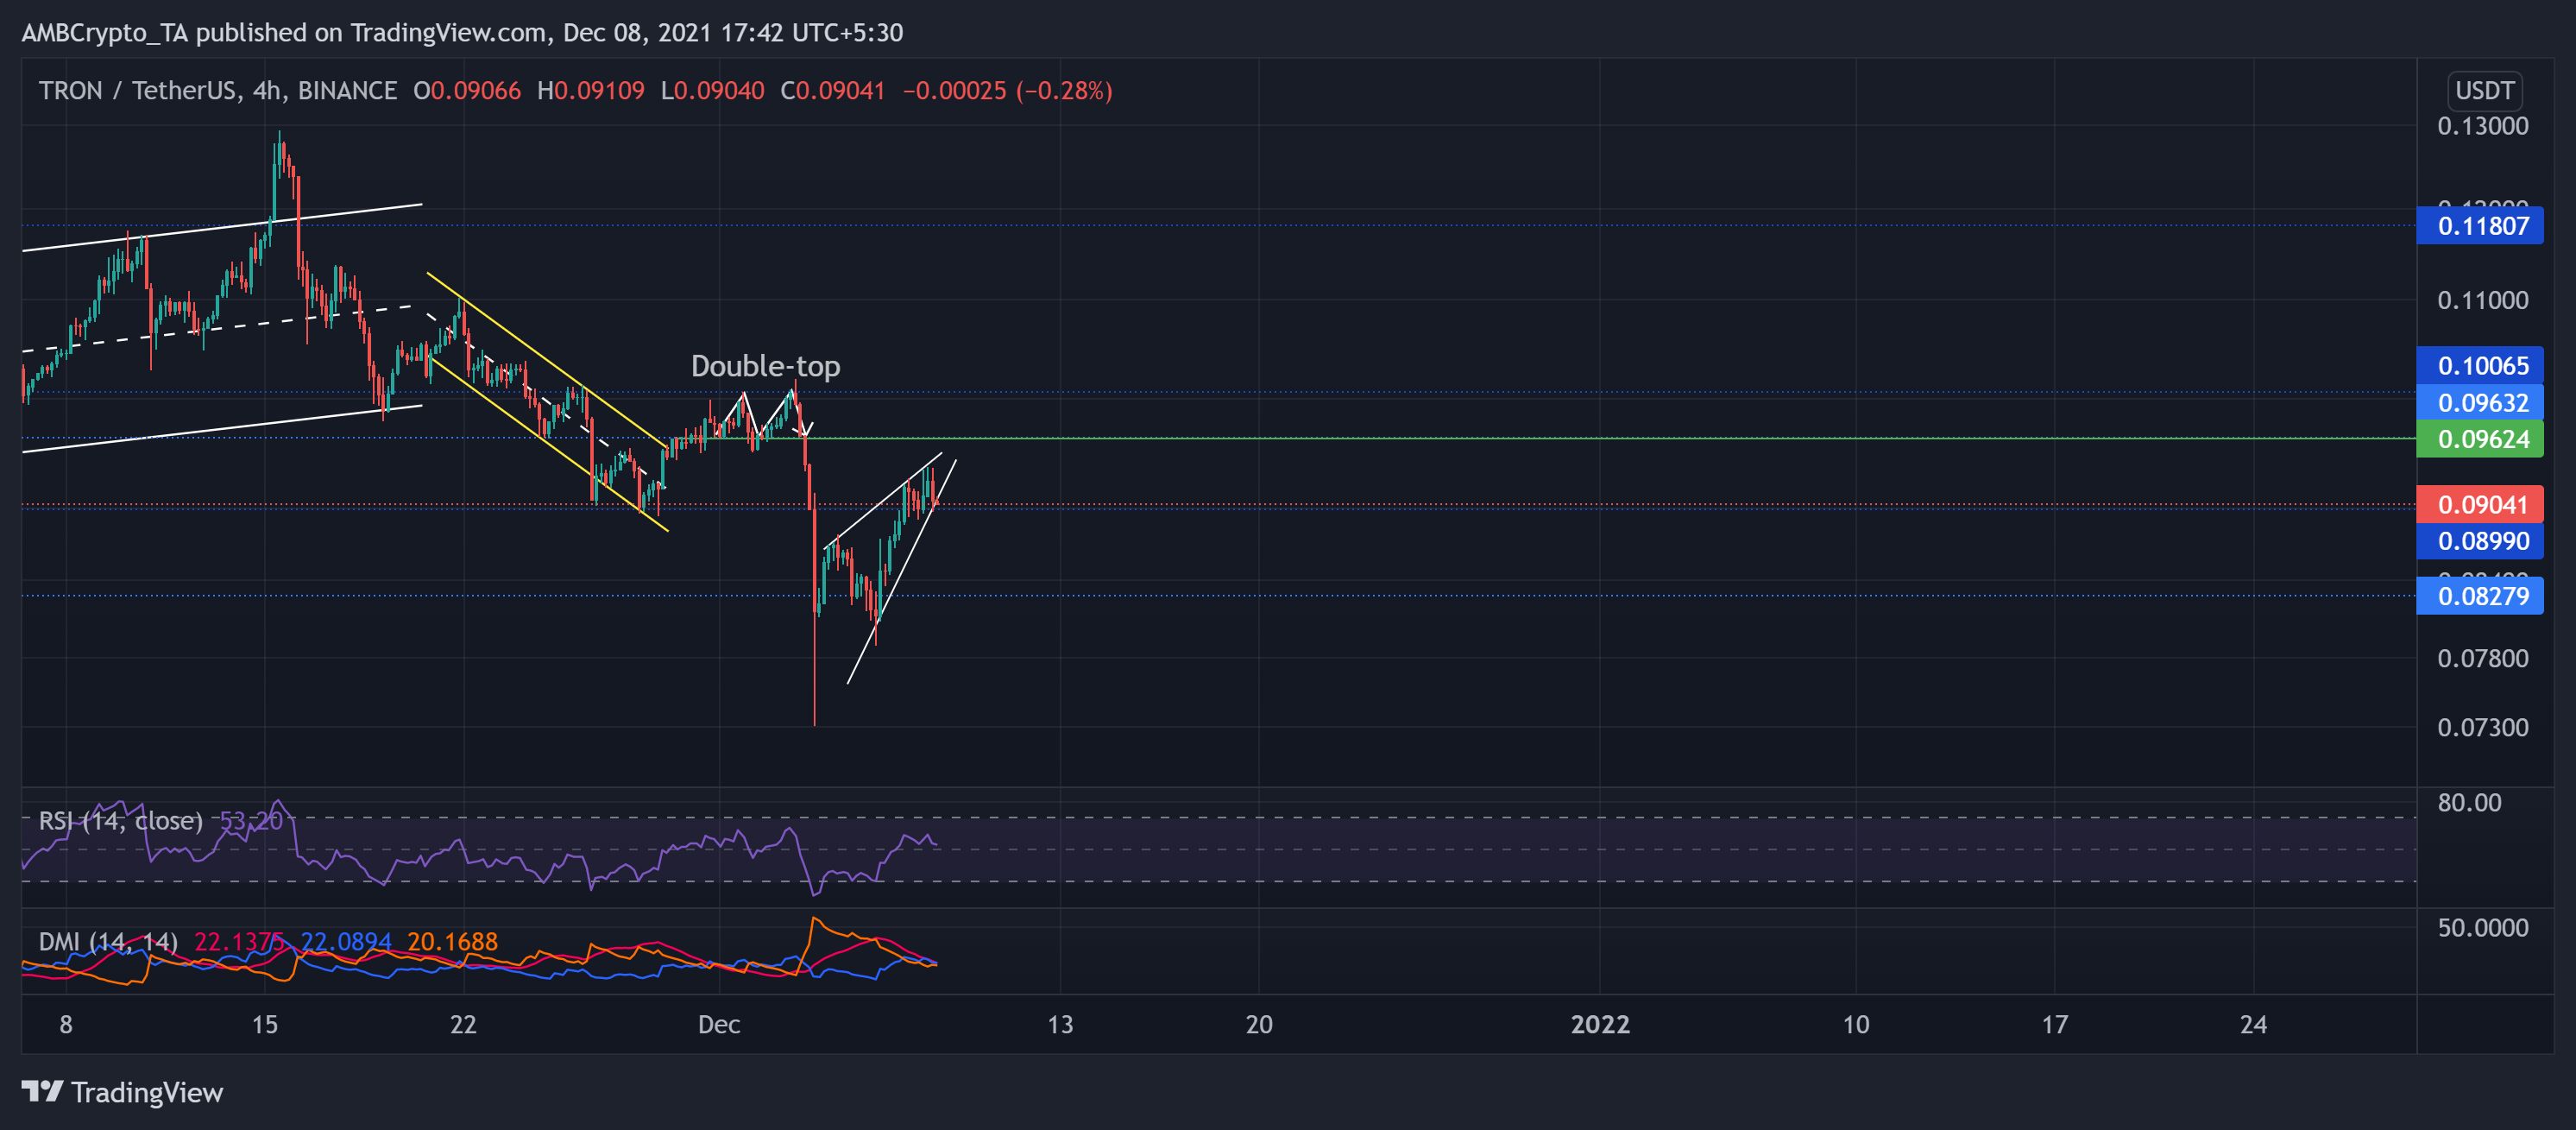
As the bears showed resistance at the $0.118-mark for the past six months, TRX steadily fell after poking its six-month high on 15 November.
The price action downturned in a descending channel (yellow). While the bulls ensured the ten-week support at the $0.0899-mark, a down-channel breakout occurred as they retested the $1.0065-mark twice. This movement formed a bearish double-top, after which the price slipped to touch its 16-week low on 3 December.
Now, TRX grew in a bearish rising wedge over the past four days. At press time, TRX traded at $0.09041. The RSI moved sideways just above the midline. Further, the DMI also depicted a marginal bullish preference, but the ADX displayed a weak directional trend.