Solana crosses these highs: How did WIF and BOME help?
Solana’s monthly fees and revenue climbed to new highs in March as DEX trading volume spiked to an all-time high.

- Solana’s DEX trading volume rose to an all-time high in March.
- Key momentum indicators showed that demand for SOL continued to rise.
The monthly trading volume of decentralized exchanges (DEXes) housed within the Solana [SOL] network surpassed $60 billion in March, setting a new high, AMBCrypto noted via DefiLlama’s data.
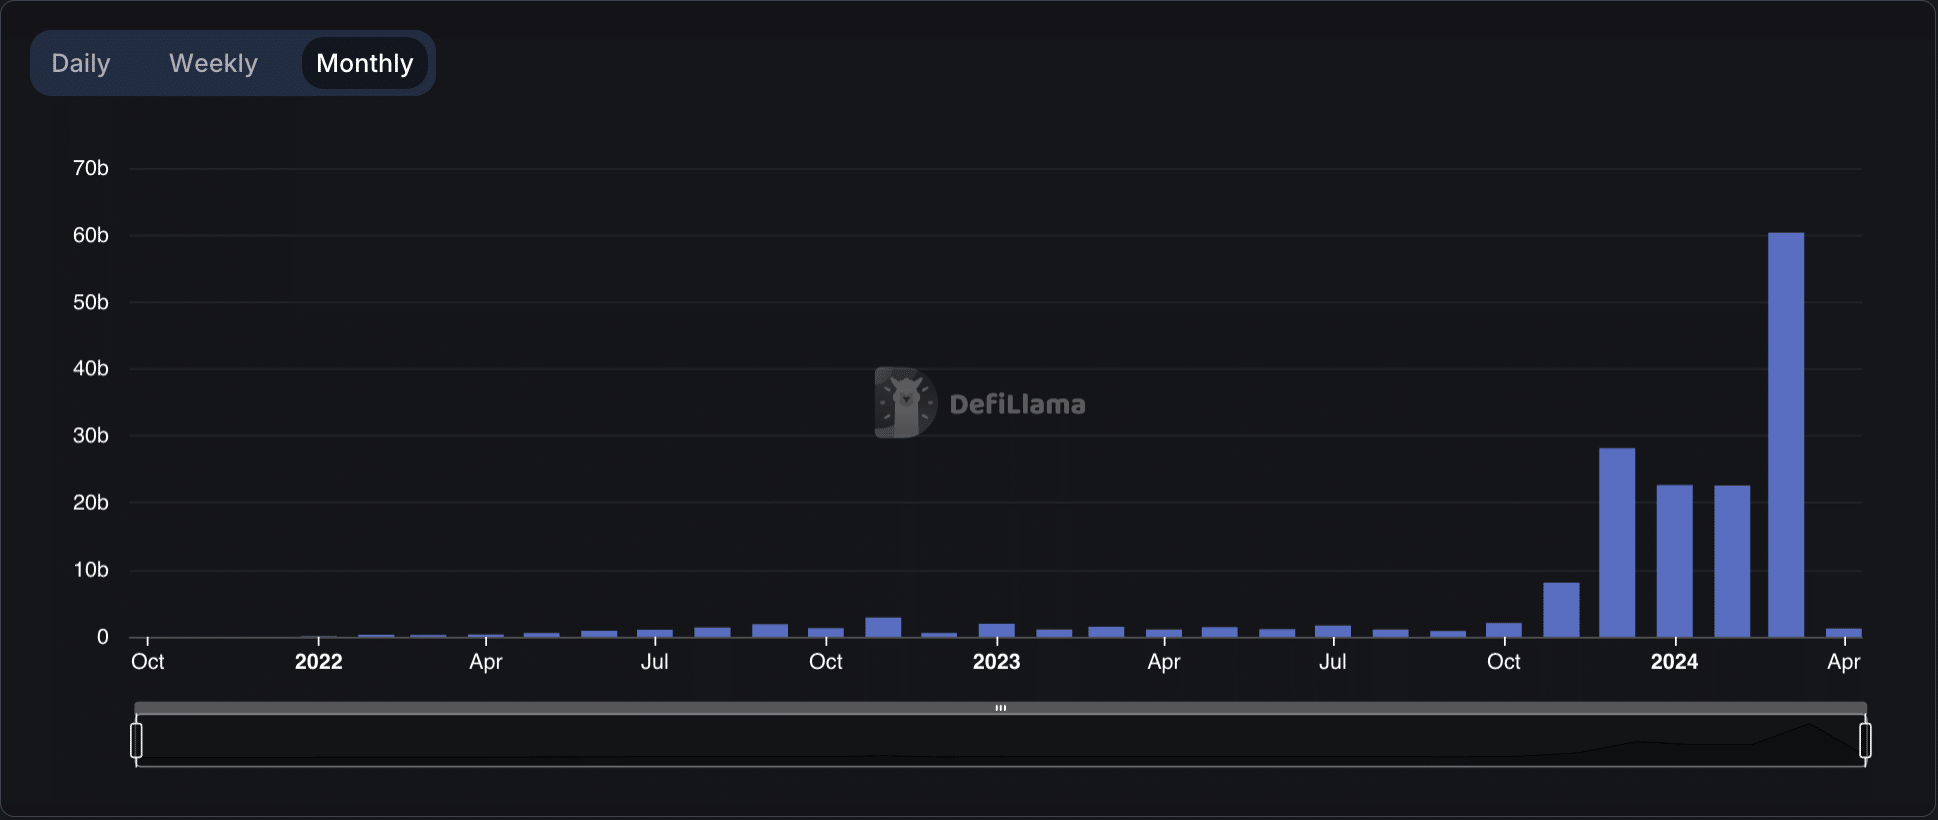
This marked a 172% spike from the $22 billion recorded in DEX volume in February.
The surge in trading volume on Solana’s DEXes in March was due to the significant interest in meme coins on the network during that period.
This spike in meme coin activity led to a rally in the prices of these assets. For example, the values of meme assets, such as Dogwifhat [WIF], rose by 140% in the last month.
Newer tokens, like Book of Meme [BOME], saw their prices rise 1773% during the same period, per CoinMarketCap’s data.
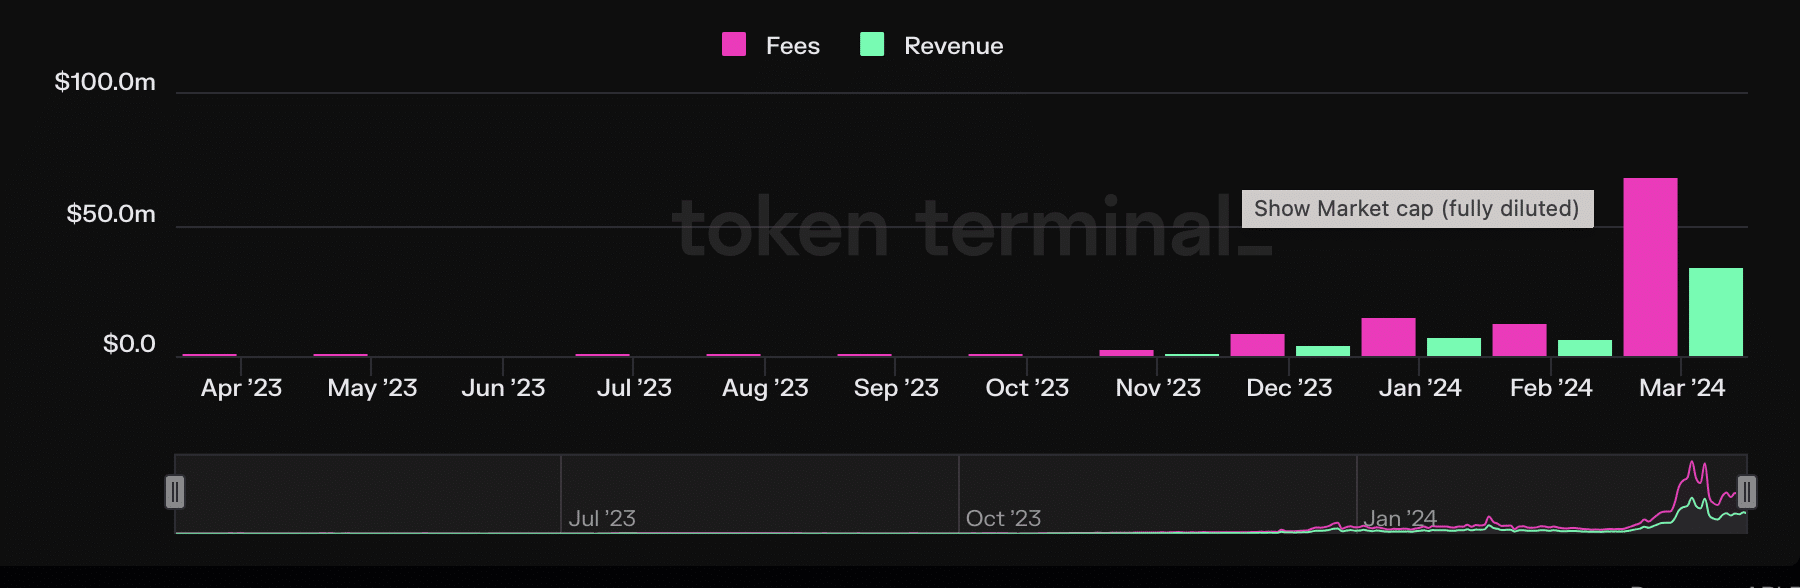
As trading activity on Solana DEXes climbed during the 31-day period, total transaction fees and the revenue derived from the same rallied to new highs.
AMBCrypto found that in March, transaction fees received by Solana totaled $69 million. This represented a 431% uptick from the $13 million the network saw in fees in February and a 360% growth year-to-date.
Likewise, according to AMBCrypto’s analysis of Token Terminal’s data, the revenue derived from March’s fees totaled $35 million. This represented a 483% month-over-month (MoM) growth in Solana’s revenue.
The market continues to demand more SOL
At press time, the network’s native coin SOL exchanged hands at $185. According to CoinMarketCap’s data, the altcoin’s value has grown by 43% in the last month.
Looking to extend its gains, an assessment of key momentum indicators on a 1-day chart revealed an uptick in demand for SOL.
For example, the coin’s Accumulation/Distribution (A/D) Line — which measures the flow of money into or out of an asset over a specific period of time — has trended upward with its price in the past two weeks.
Read Solana’s [SOL] Price Prediction 2024-2025
When an asset’s A/D Line moves in the same direction as its price, it confirms the strength of the price trend. Therefore, when an asset’s price and its A/D Line climb, it signals that buying pressure is increasing.
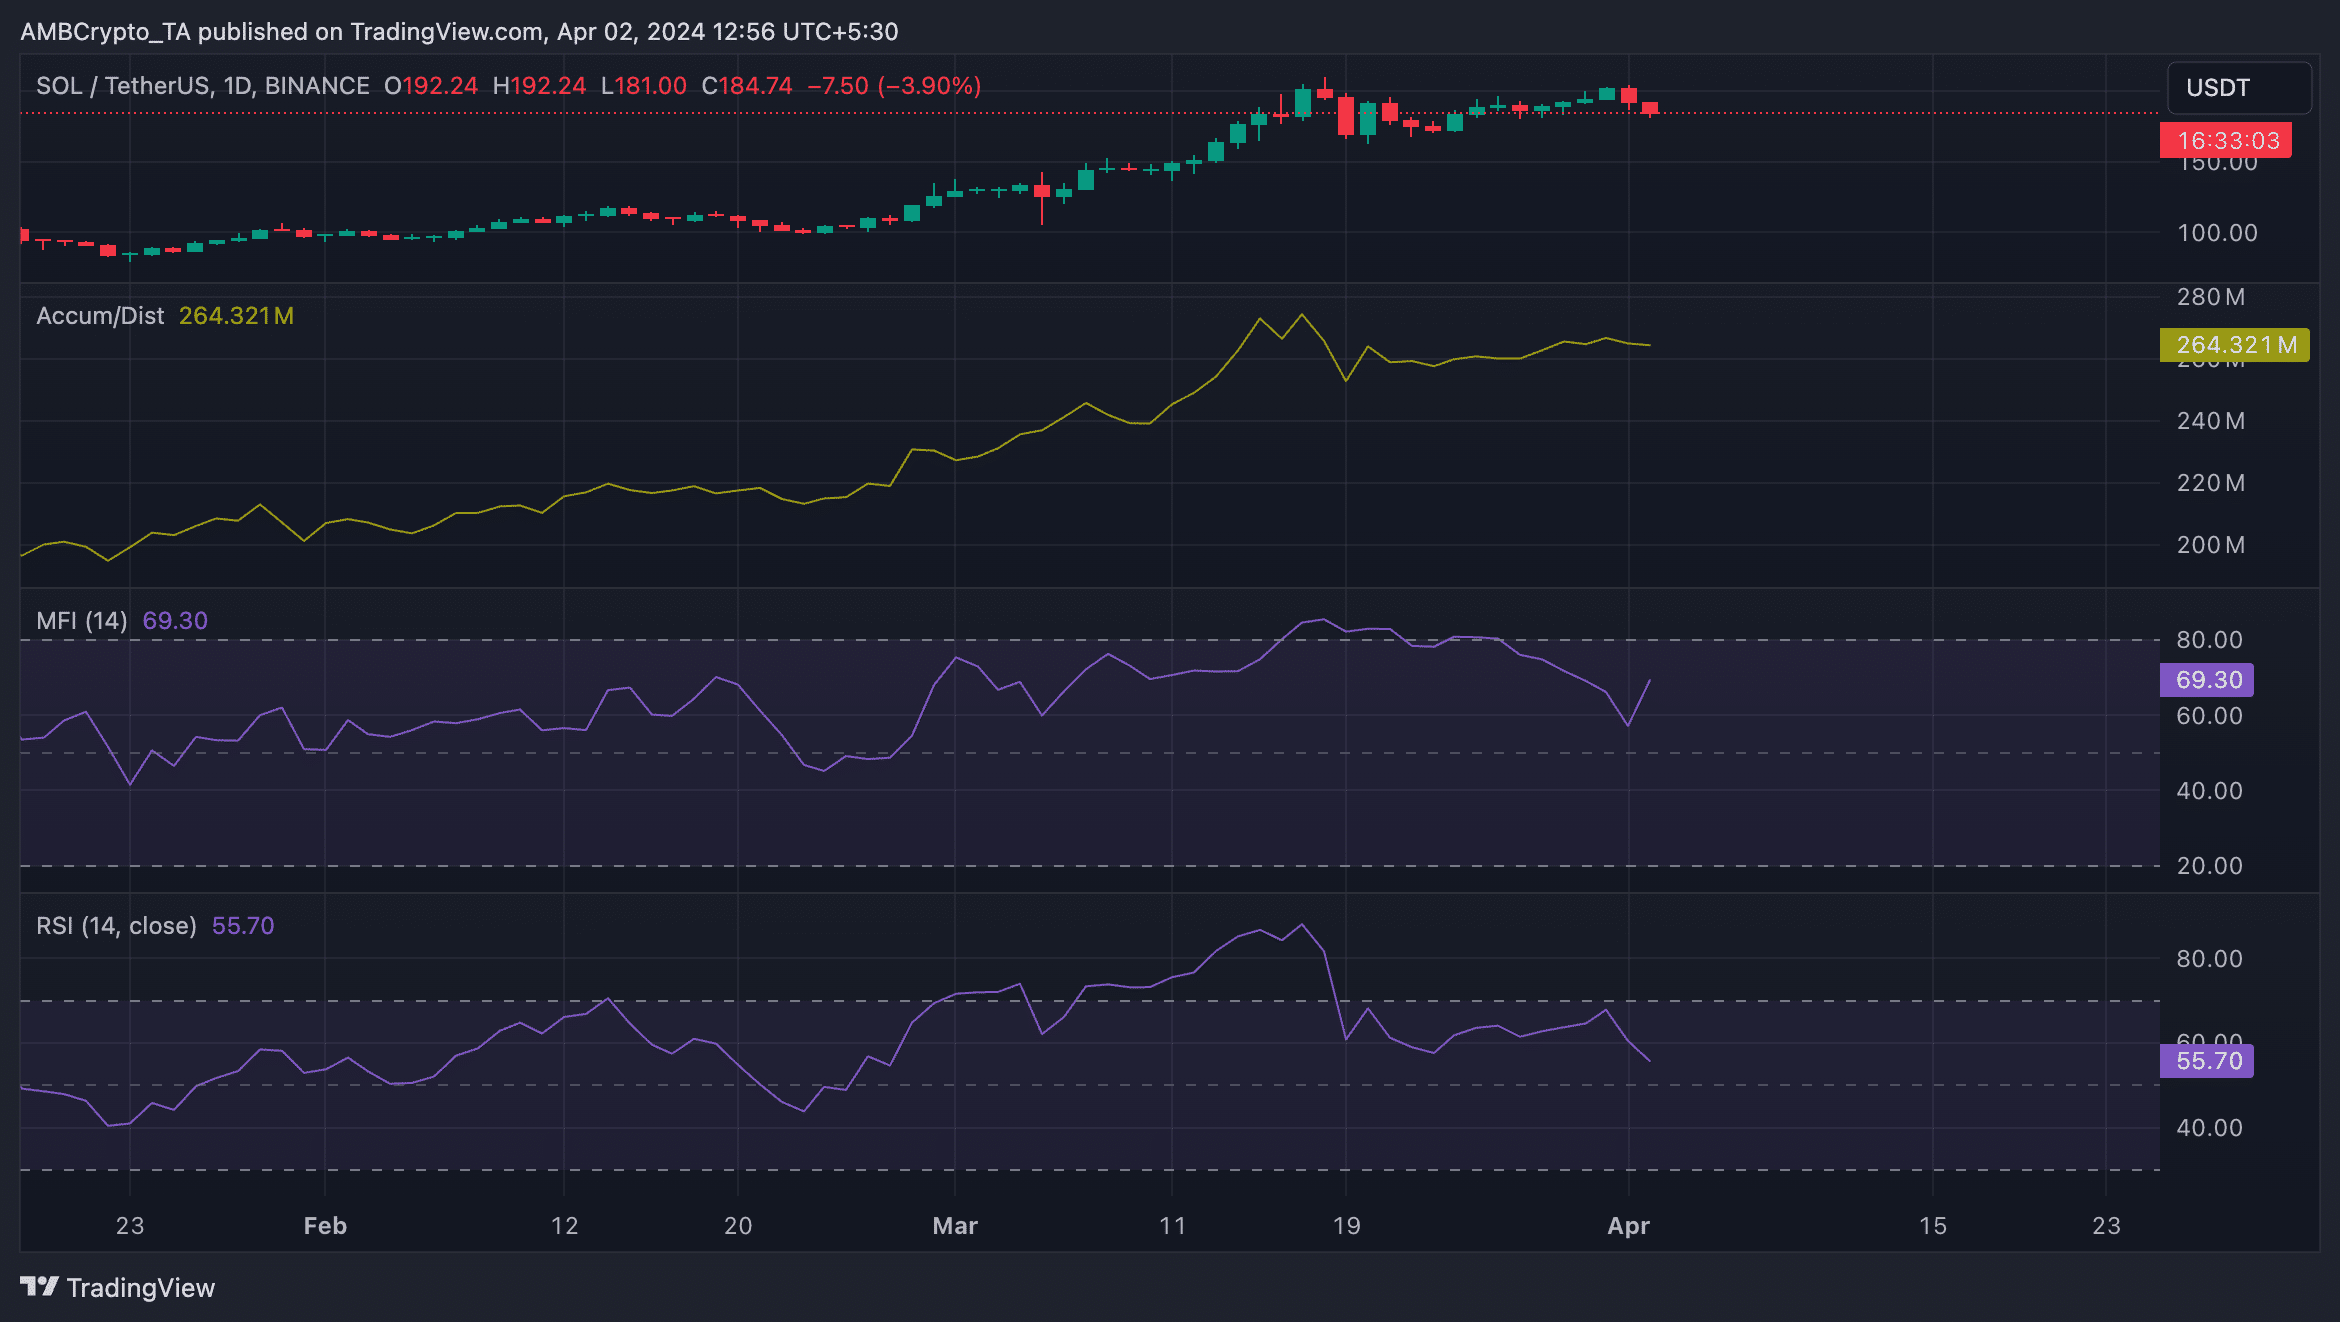
Also, SOL’s Money Flow Index (MFI) and Relative Strength Index (RSI) rested above their center lines, confirming the market’s preference for coin accumulation over distribution.


