Solana, Fantom, Axie Infinity Price Analysis: 17 January

While the market still hovered around the $2.18T-mark, most large-cap (top 15) cryptos struggled to trade in the 24-hour green zone. As a result, Solana projected weak technicals after a rising wedge breakdown on its 4-hour chart.
On the other hand, Fantom flashed bullish near-term technicals as it again eyed to test its ATH level. Further, Axie Infinity jumped above its 20/50 SMA while its CMF was on a downtrend.
Solana (SOL)
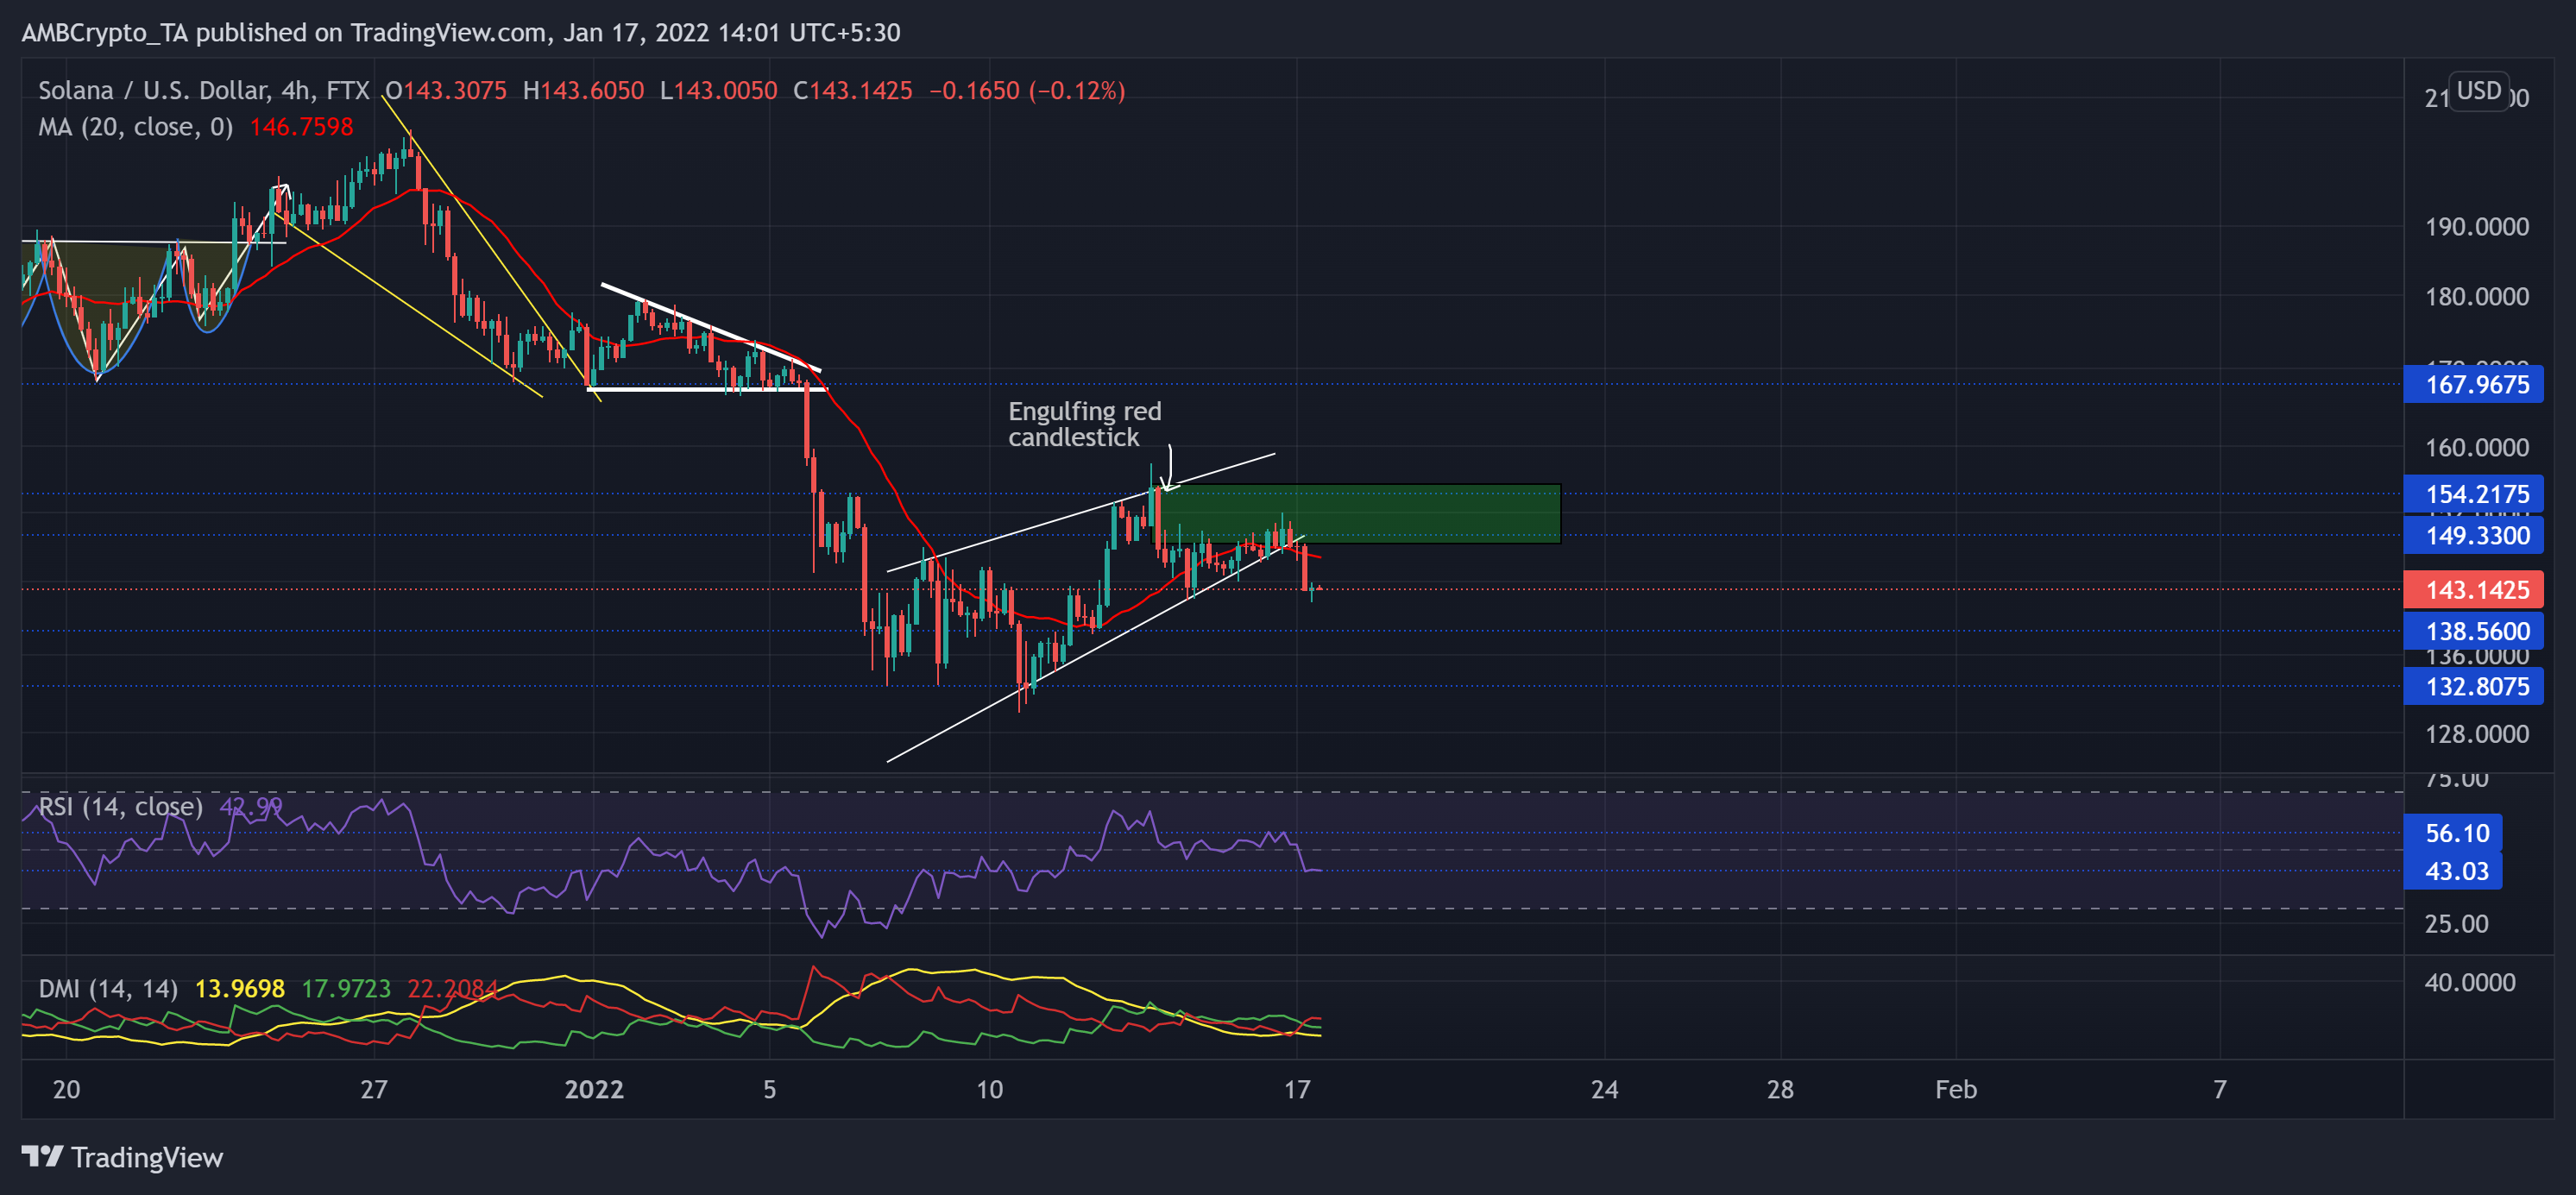
SOL formed a rising wedge (white) on its 4-hour chart and now saw an awaited fallout over the past day. Since it saw a red engulfing candlestick on 14 January, the bulls struggled to cross the $149-resistance.
The buyers failed to step in at the $167-level. Thus, the alt saw an over 23% retracement (from 5 January) until it poked its 15-week low on 10 January.
Now, any close above the 20-SMA (red) could further lead to a test of its immediate supple zone (rectangle, green). On the flip side, any retracements would find support at the $138.5-level.
At press time, the alt traded at $143.1425. The RSI was bearish after it lost the midline support. Any close below 43 would be detrimental for the bulls. Also, the DMI reaffirmed a bearish preference. But the ADX (directional trend) was extremely weak.
Fantom (FTM)
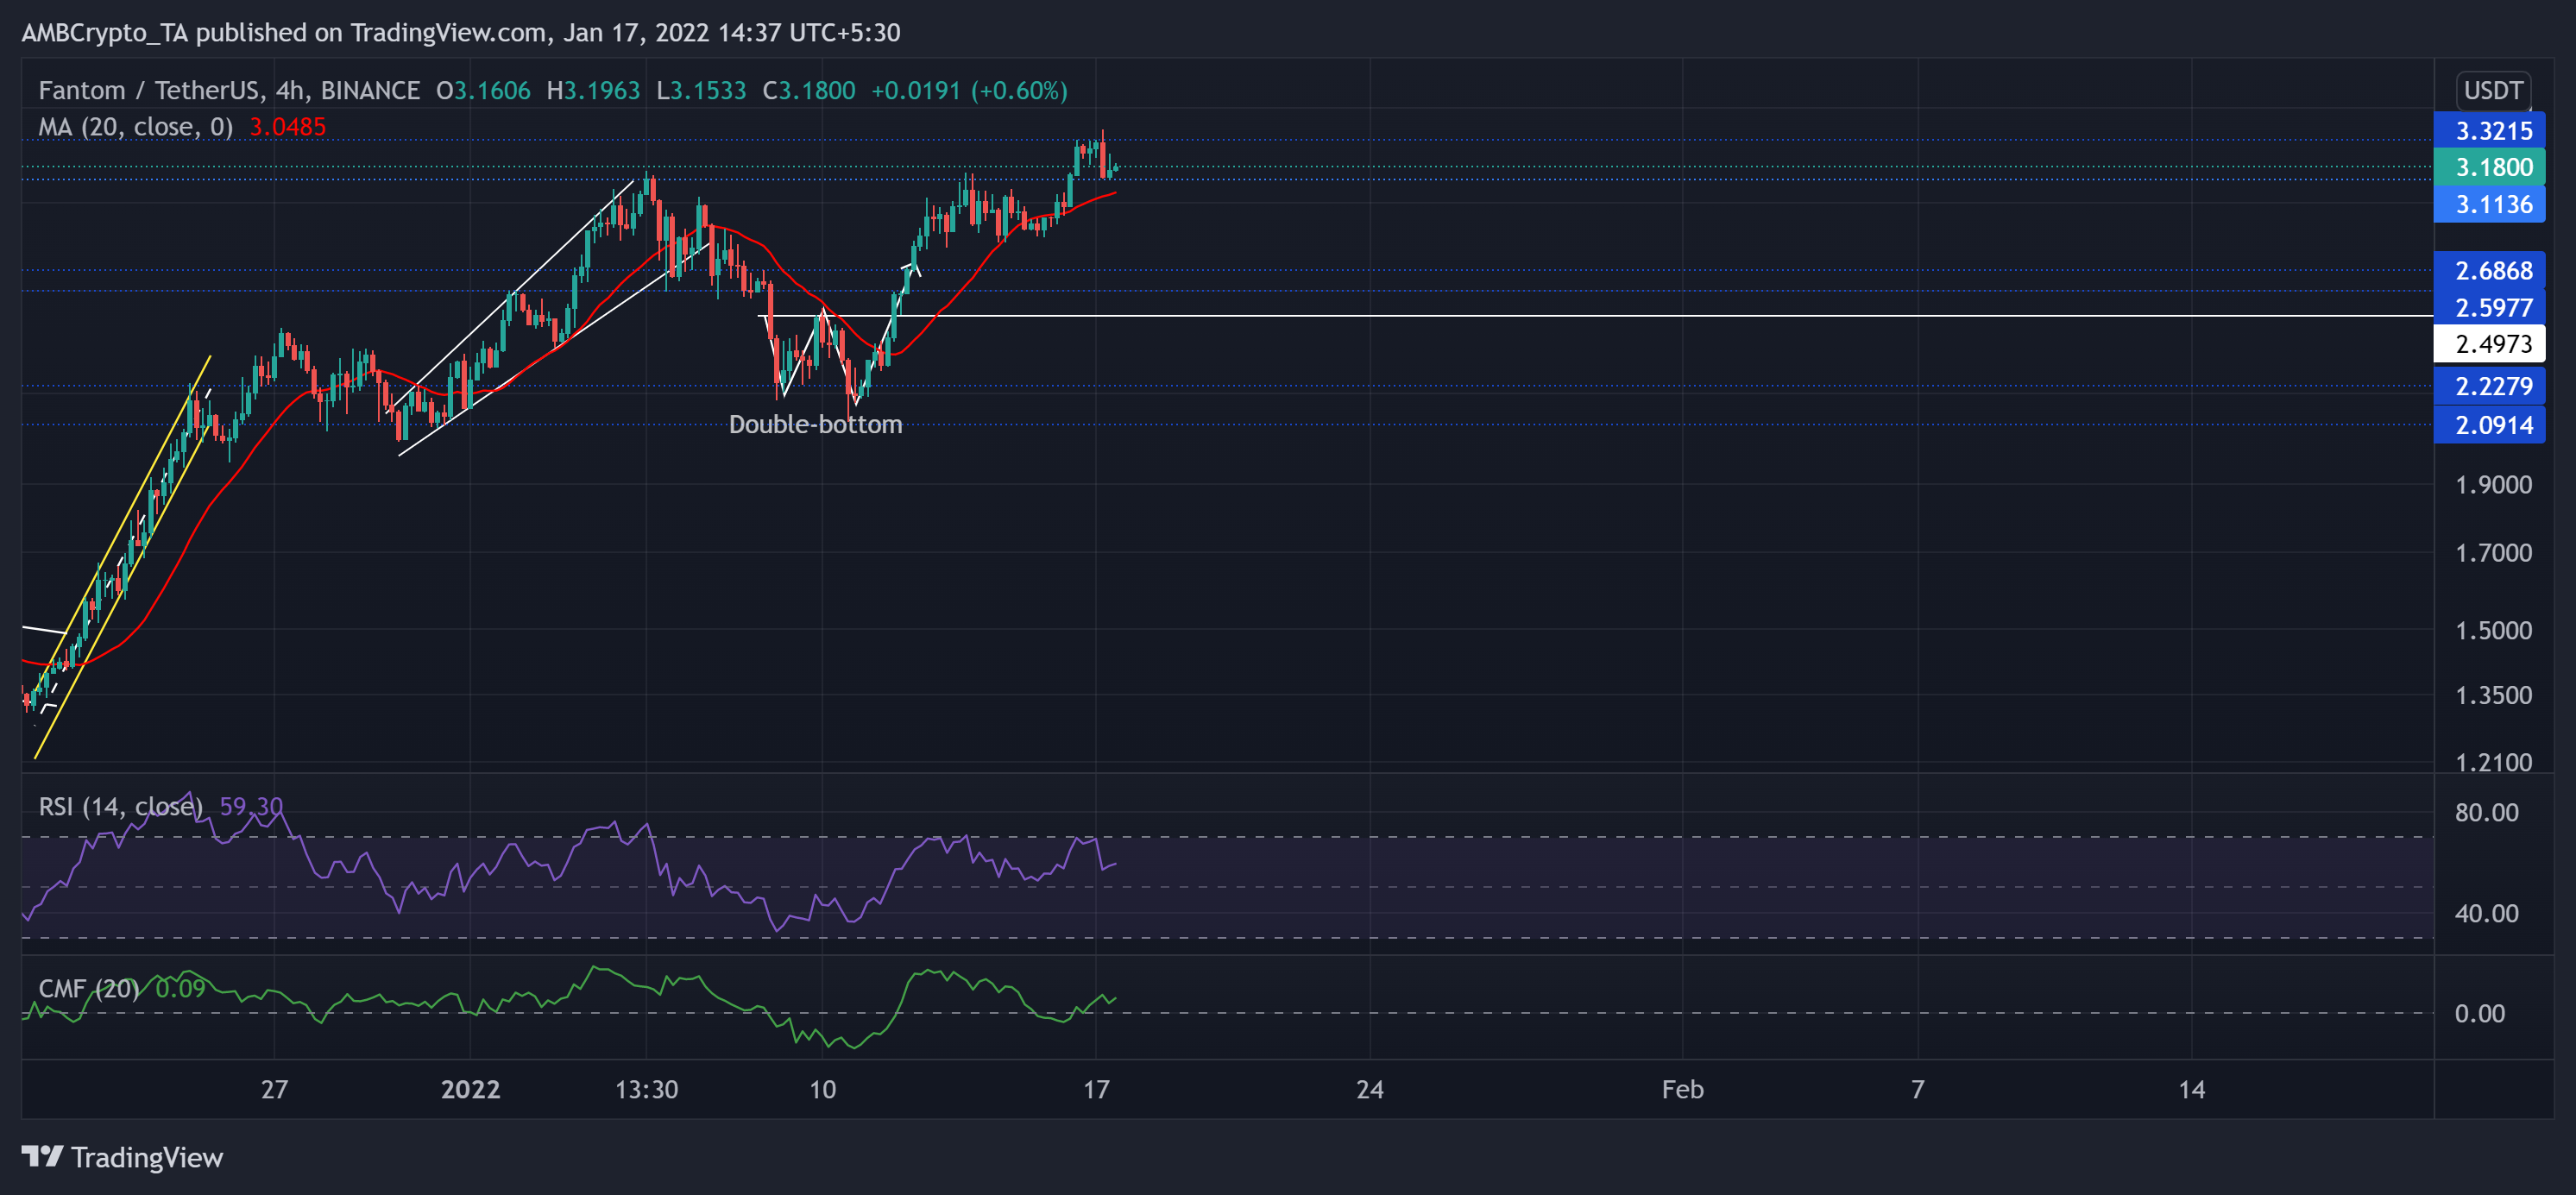
The ascending broadening wedge (white) saw a break down after touching its long-term $3.11-resistance (now support). Then, after losing over a third of its value, FTM tested the $2.22-mark.
From here, it saw an exceptional rally after forming a double-bottom on its 4-hour chart. FTM gained a staggering 59.7% ROI from the 10 January low until it poked its 11-week high on 17 January. The 20-SMA (red) stood as strong support during the ascent.
At press time, FTM traded at $3.18. The RSI tested the overbought region twice before a fall toward the 58-level. It flashed a bullish preference and still did not show any slowing signs. The CMF comfortably crossed the zero line and was now northbound. This reading hinted at increasing money flow volumes into its network.
Axie Infinity (AXS)
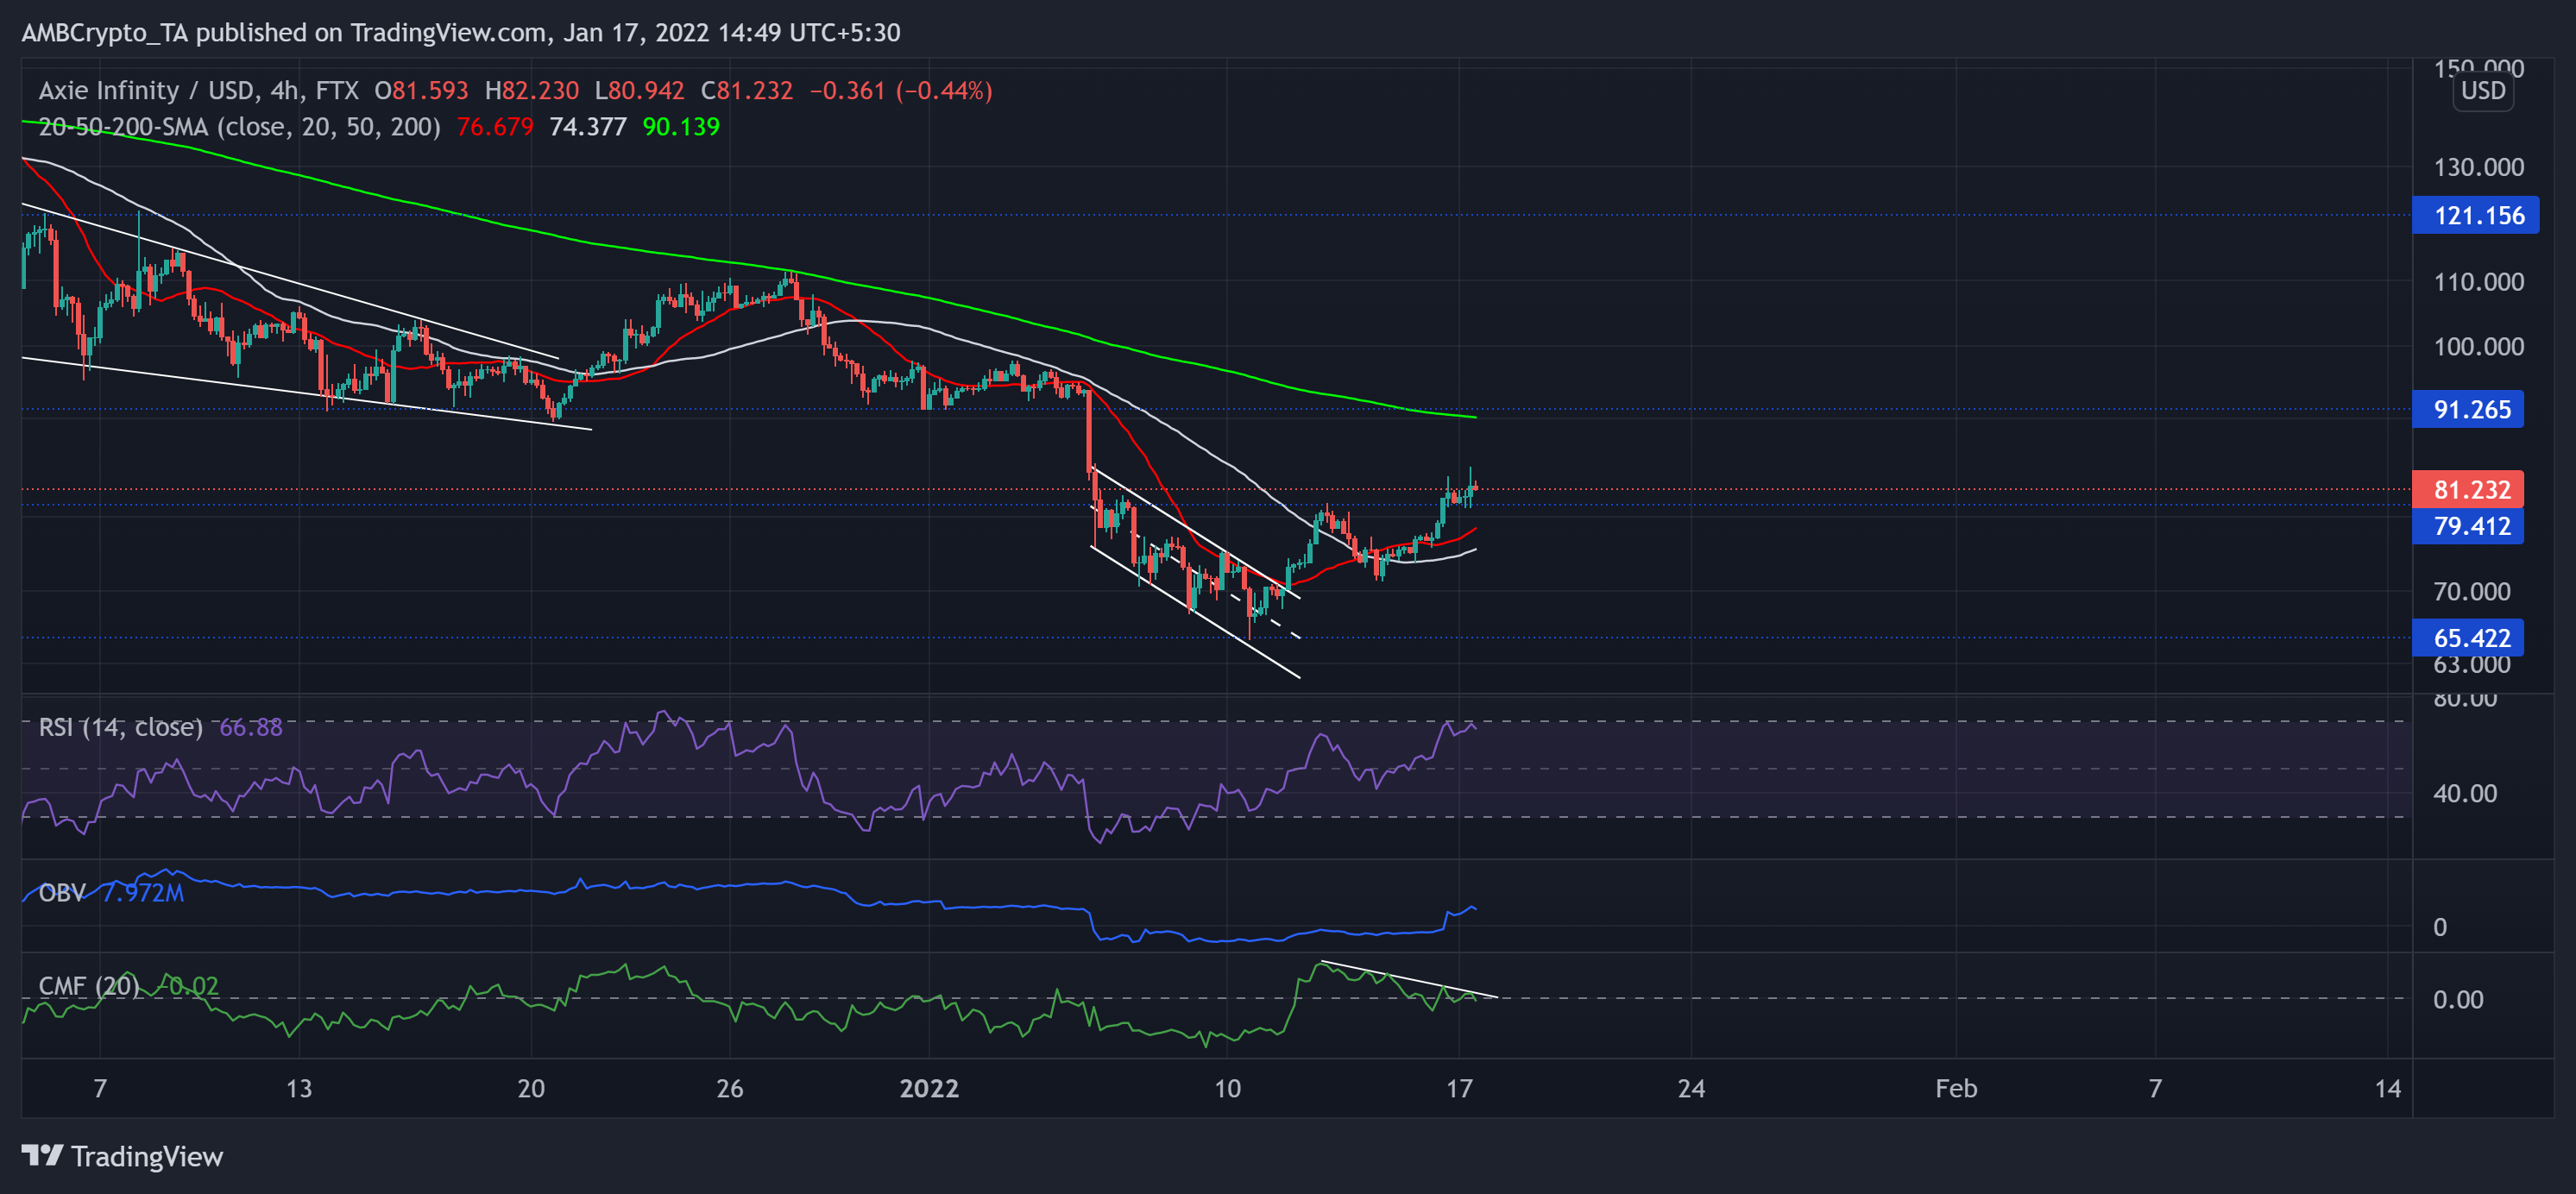
The altcoin noted a 5.7% gain on its charts in the last 24 hours. Since striking its ATH on 6 November, AXS steadily declined and lost $121.1 and the $91.2-mark range.
With the recent down-channel (white) breakout, the alt reclaimed 27.7% of its value from (from 10 January) and jumped above its 20-50 SMA. AXS also reclaimed the $79.4-mark immediate support.
At press time, AXS at $81.232. The RSI saw a solid upturn but took a dip from the overbought region and showed slightly slowing signs. Also, the OBV saw a spike, confirming the increased buying pressure. However, the CMF marked lower peaks during the recent bull run, hinting at decreasing money infusion.