Solana – Here are $13 million reasons behind SOL’s latest rally
The bullish divergence between SOL’s price and a key technical indicator may be hinting at a reversal.

- SOL’s price has risen by almost 15% in the past 24 hours.
- Bearish outlook continues to persist in the altcoin’s market.
Solana’s [SOL] double-digit price rally over the last 24 hours has resulted in the liquidation of some short positions in its Futures market, according to Coinglass data.
At press time, SOL was valued at $145.12, up by 11% in just 24 hours. According to CoinMarketCap’s data, SOL is the only coin amongst the top five cryptocurrency assets by market capitalization to record double-digit gains in the last 24 hours, ahead of Bitcoin’s halving event.
Liquidations happen in an asset’s derivatives market when a trader’s position is forcefully closed due to insufficient funds to maintain it. Short liquidations occur when the value of an asset suddenly rises, and traders who have open positions in favor of a price decline are forced to exit their positions.
According to Coinglass data, SOL’s short liquidations totalled $13 million in 24 hours. Long liquidations, on the other hand, amounted to $9 million.
To what end is the rally?
An assessment of SOL’s price movements on the one-day chart suggested that the double-digit price growth of the last 24 hours may have been short-lived. In fact, bearish sentiments continue to outshine bullish activity among market participants.
The dots that make up SOL’s Parabolic Stop and Reverse (SAR) indicator were spotted above SOL’s price at press time, and they have been positioned so since 5 April.
The indicator identifies potential trend directions and reversals. When its dots rest above an asset’s price, the market is said to decline. It indicates that the asset’s price has been falling, and the downtrend may linger.
Read Solana’s [SOL] Price Prediction 2024-25
Furthermore, readings from SOL’s MACD line (blue) revealed it resting below the coin’s signal (orange) and zero lines. This suggested that the asset’s small moving average was below its longer-term moving average.
This crossover, which occurred on 22 March, marked a shift in momentum from bullish to bearish and confirmed that SOL’s selling activity has since outpaced its accumulation.
Interestingly, despite the extended decline in SOL’s price, its Chaikin Money Flow (CMF) continued to rise – A bullish divergence.
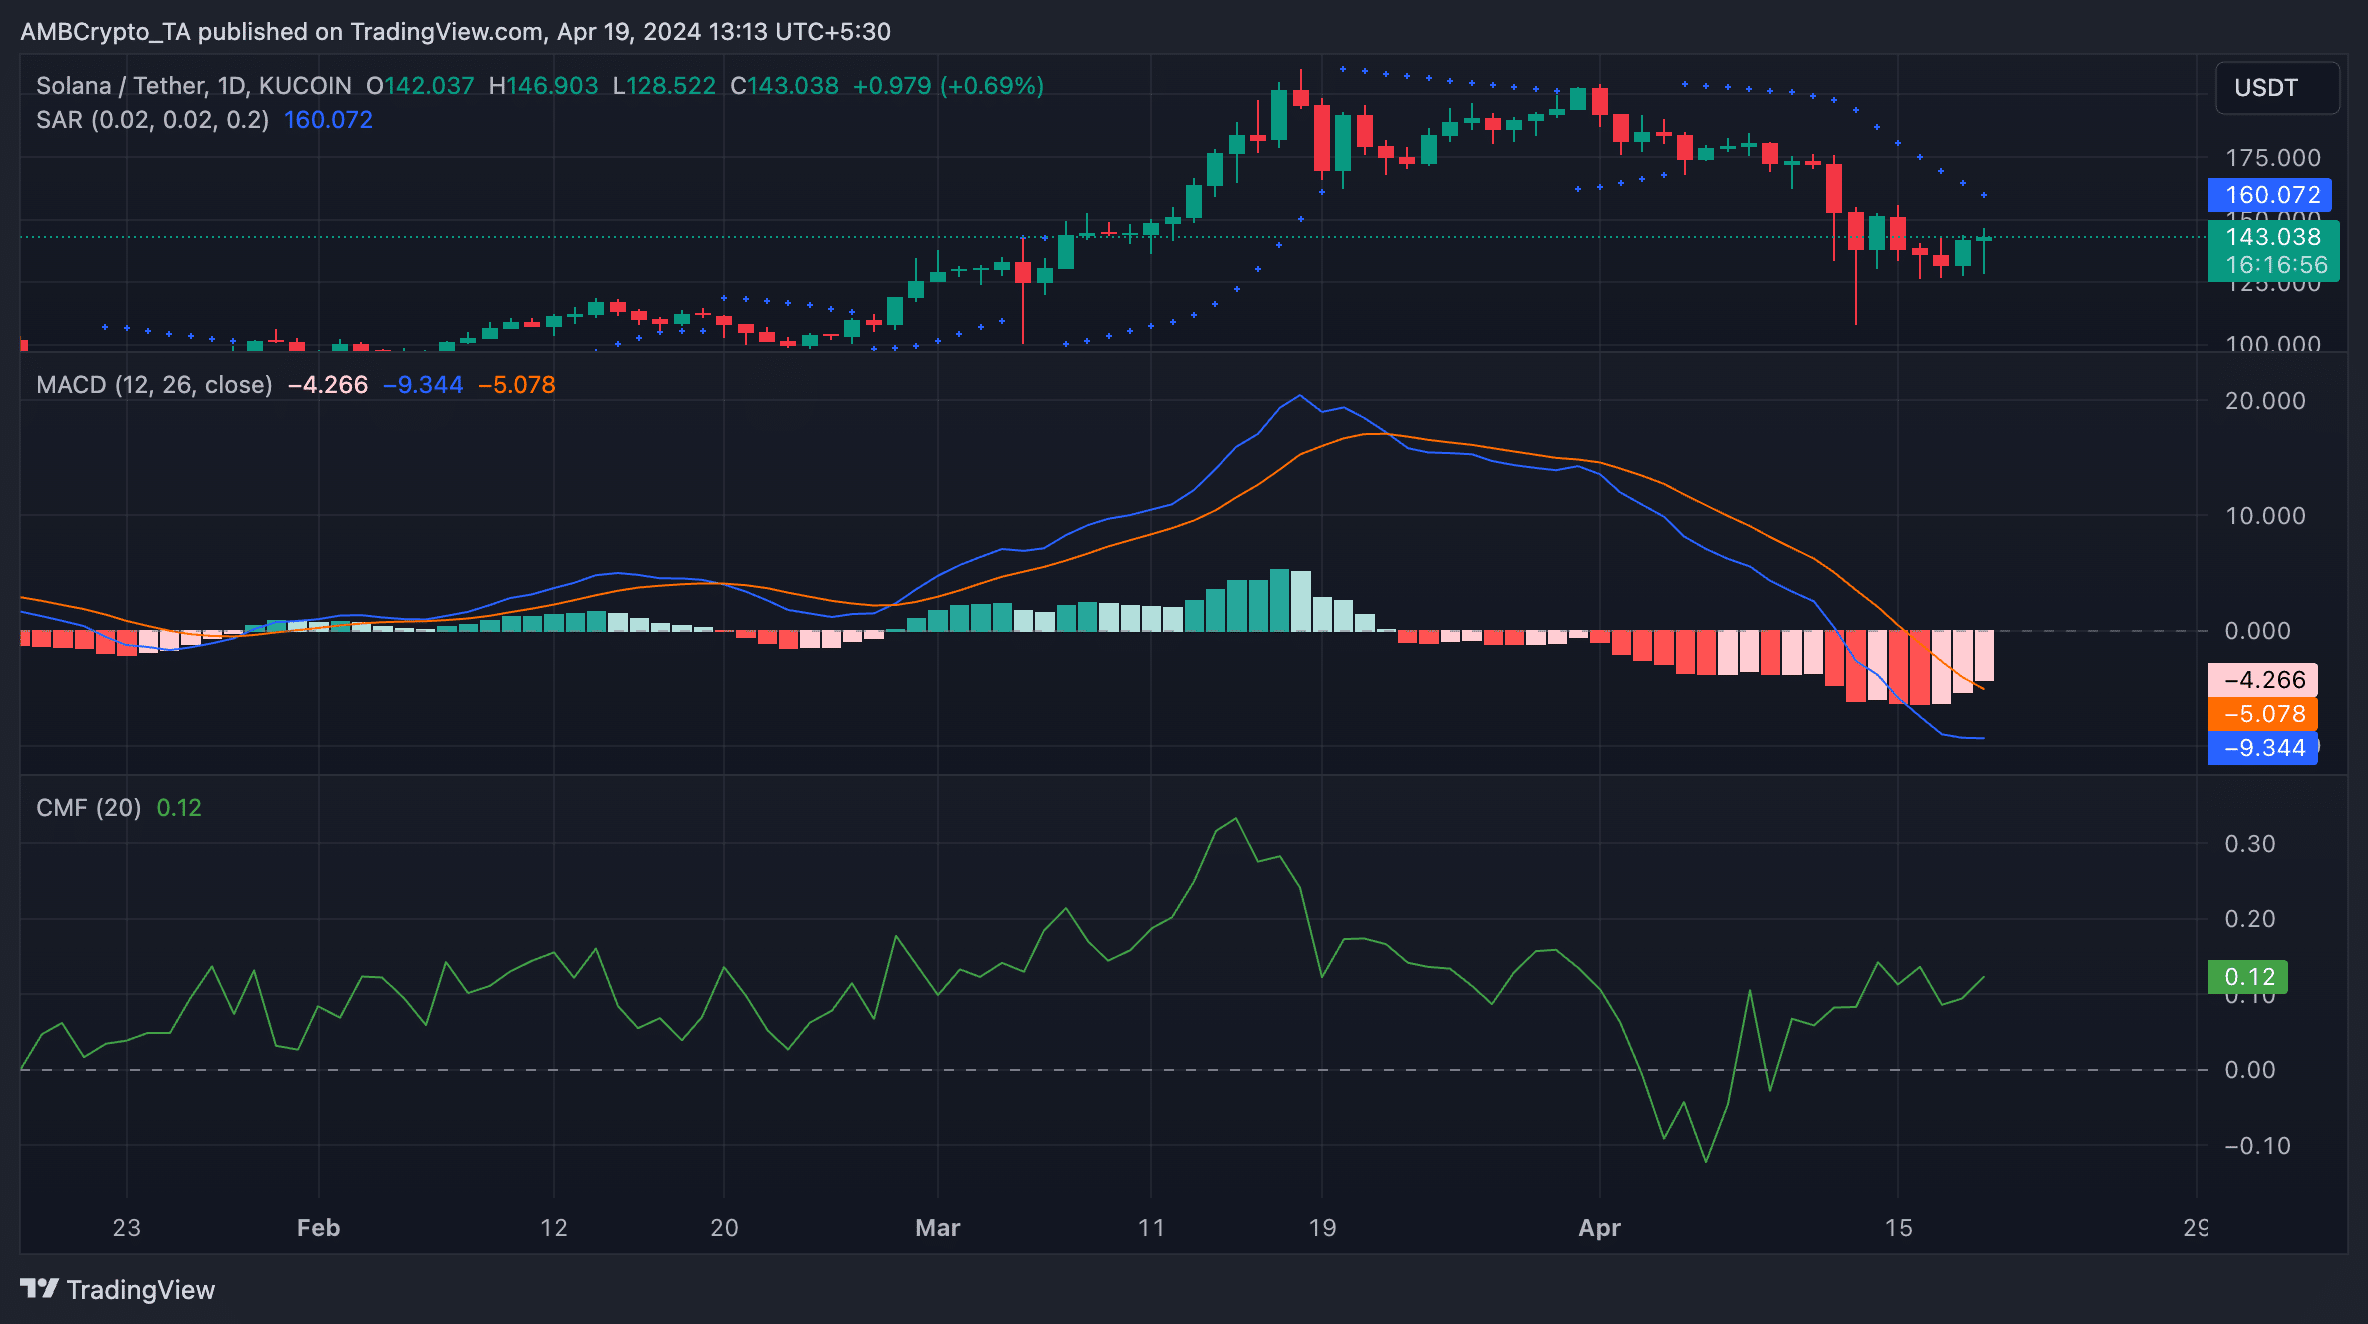
This could mean that although SOL registered a price decline, the asset still has significant buying interest. Larger market participants could be accumulating SOL despite the price drop, in anticipation of a reversal.


