Solana: Here’s what traders should watch out for in the short-term

Disclaimer: The information presented does not constitute financial, investment, trading, or other types of advice and is solely the writer’s opinion.
- The H4 market structure was bearish.
- A good buying opportunity might arise only after another drop in the price charts.
Solana recently made waves on social media, but for all the wrong reasons. Over the weekend the network went 20 hours without processing a single transaction. The price charts reflected this and SOL was unable to climb past the $23.5 level of resistance.
Read Solana’s [SOL] Price Prediction 2023-24
Therefore, a retest of the same region could offer selling opportunities. But the indicators showed buying pressure was on the rise- can traders expect a breakout instead?
Short-sellers can wait for a reaction at the mid-range mark
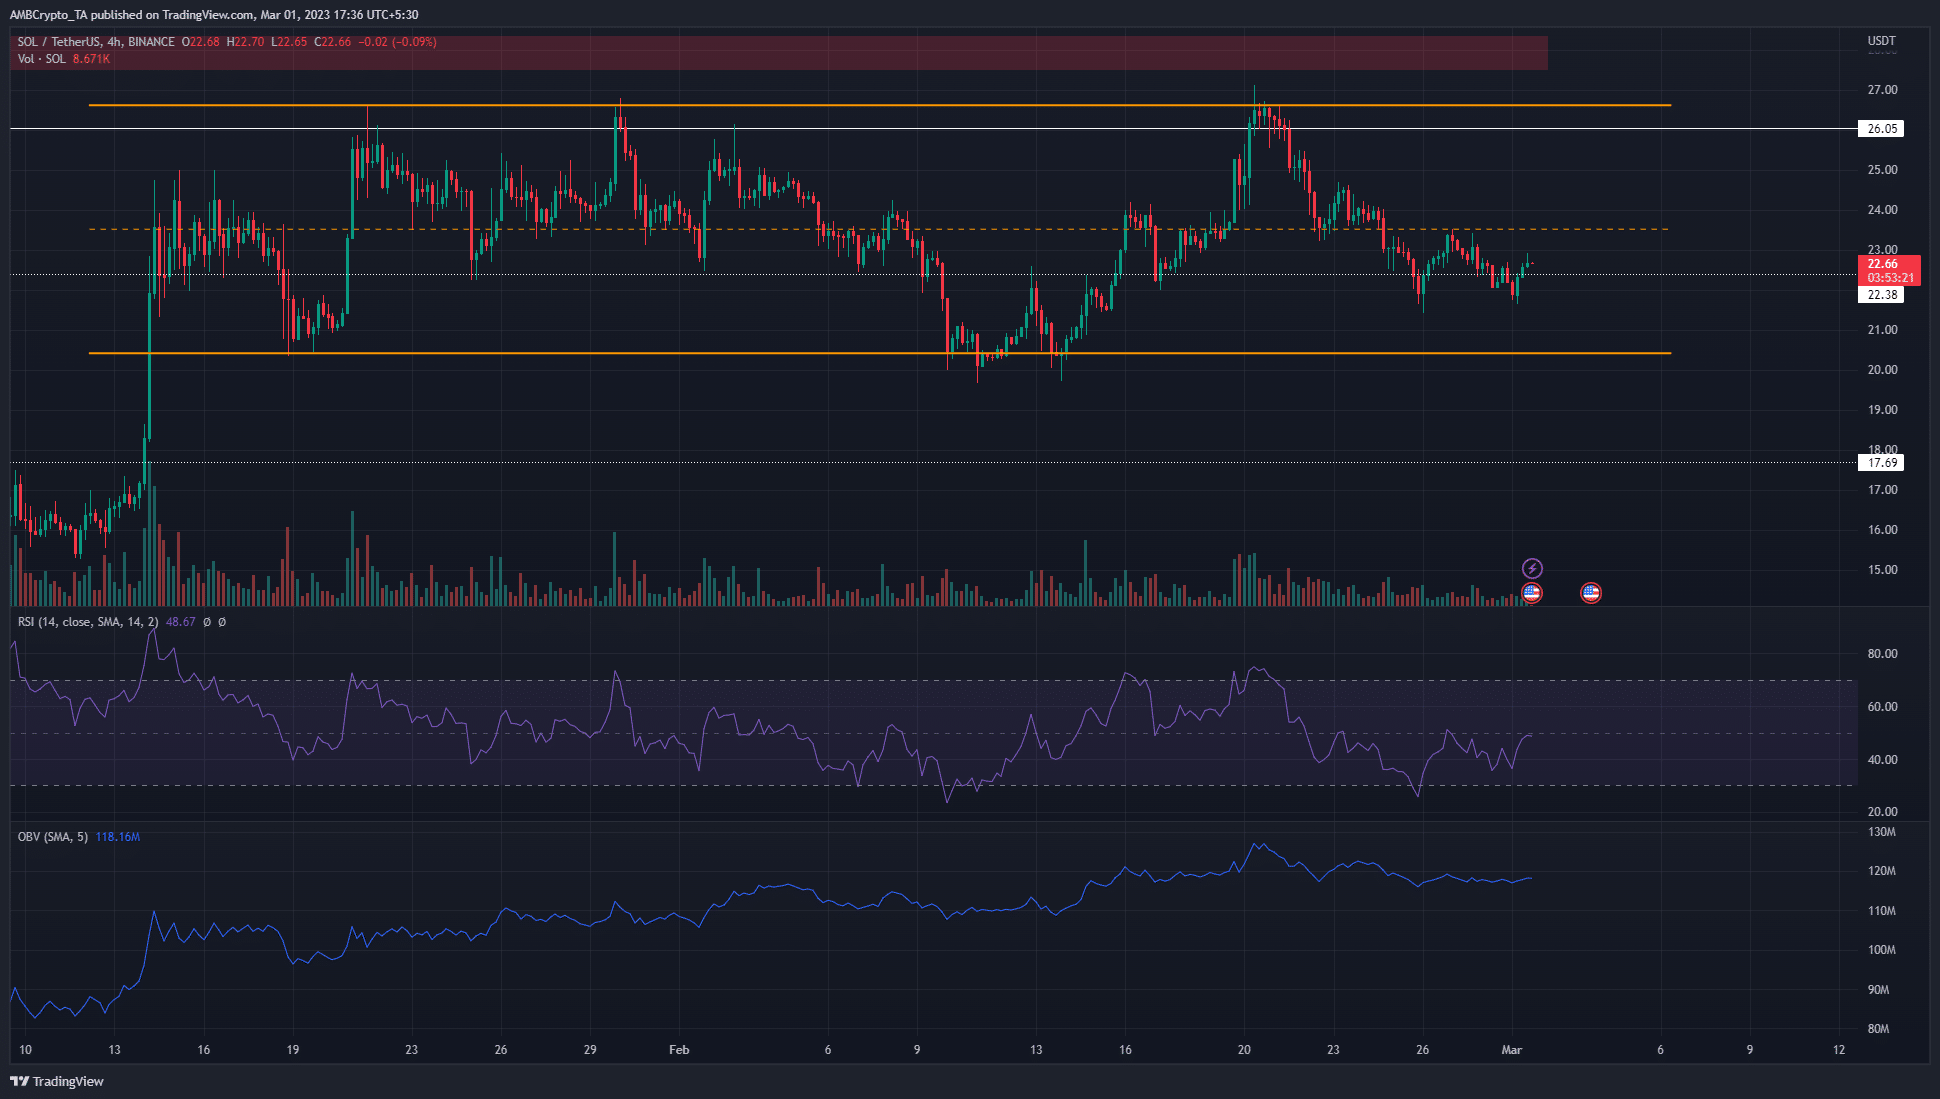
Since 25 February, Solana has bounded between $21.9 and $23.3. Between these levels, the price has also faced support and resistance at the $21.75 mark. On the higher timeframes, SOL traded with a range that extended from $20.4 to $26.6, with the mid-range mark at $23.5.
Moreover, in the past two weeks, Solana has faced rejection at the mid-range mark. This showed that aggressive short sellers can look to short a retest of the same level, with a tight stop-loss in the $23.8 region.
More risk-averse traders can wait for Solana to sink to the vicinity of the $20 support before buying. They can even wait for a push above the mid-range mark and its retest as support. The indicators showed this was a likelihood.
Is your portfolio green? Check the Solana Profit Calculator
The RSI has been below neutral 50 since 22 February but it climbed to 49 over the past couple of days.
This signaled the bearish momentum was weak and could be flipped soon. Another indicator in favor of the bulls was the OBV. It has formed higher lows throughout February but saw a relatively minor decline over the past ten days. Therefore, the rejection at $26 was not followed by immense selling.
The Open Interest showed participants could be on the fence about Solana
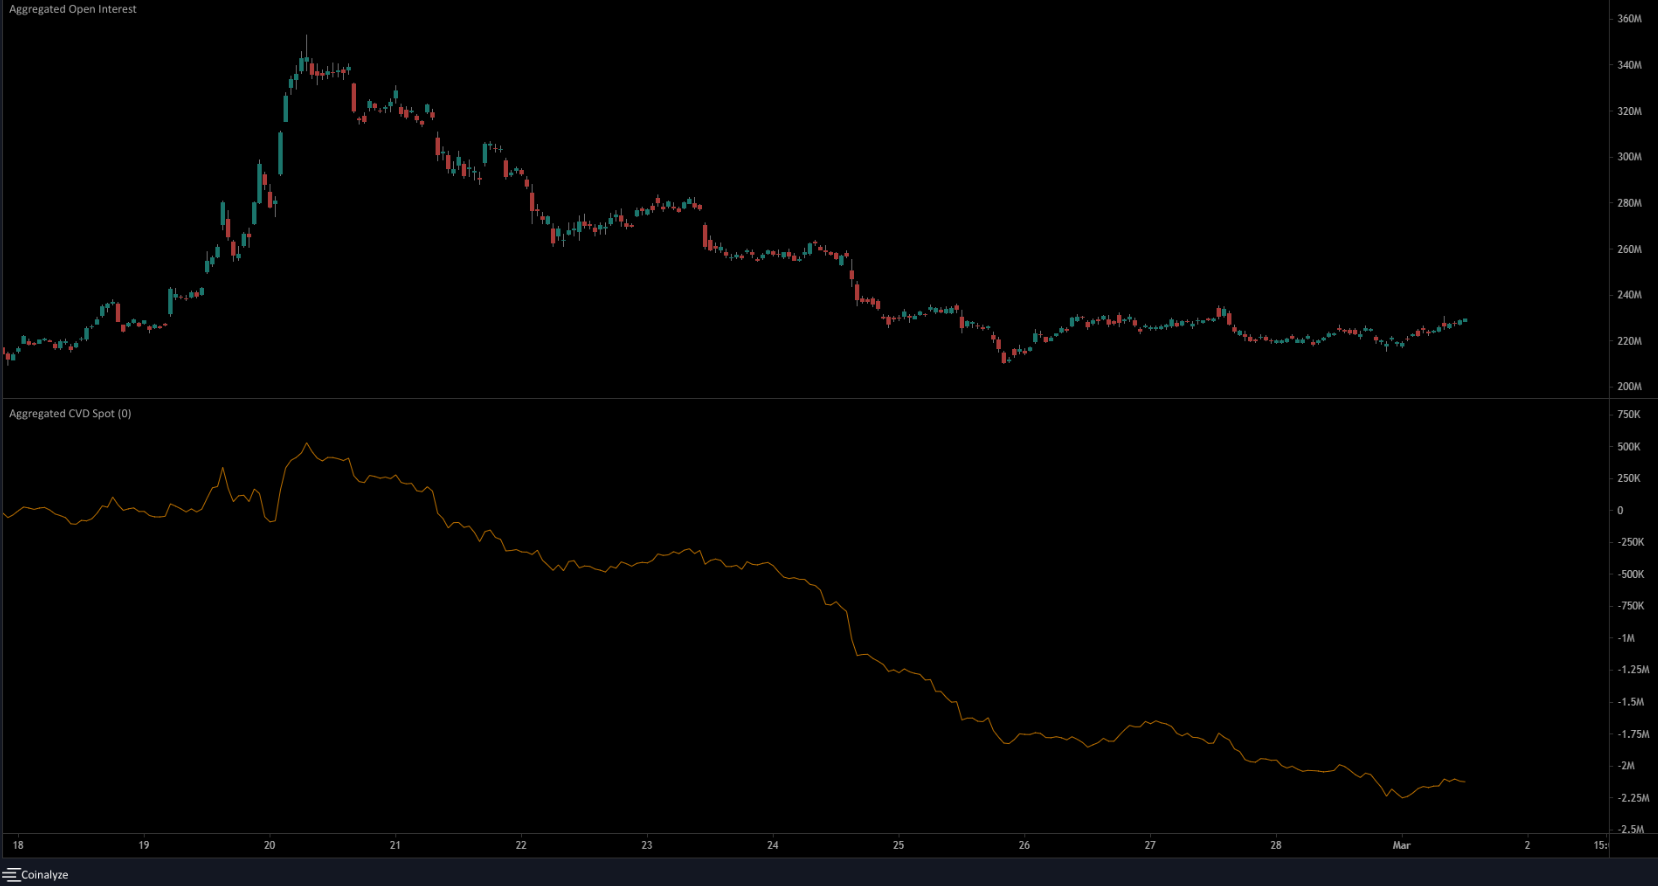
The 1-hour chart showed Open Interest was flat from 26 February onward. During that time, the price dropped from $23.5 to $21.9, before bouncing to trade at $22.6 at press time. This bounce was accompanied by some increase in the OI.
If the OI rushed rapidly northward after a move above $23.5, bulls can expect a continuation as sentiment would be strongly bullish in such a scenario.
The spot CVD was in decline in recent days, and highlighted strong selling pressure, in contrast to the OBV. In combination with the market structure as well, bears had the upper hand on the 4-hour timeframe. A move above $23.5 could change this.