Solana: Here’s why bearish bias makes sense despite bullish momentum

Disclaimer: The information presented does not constitute financial, investment, trading, or other types of advice and is solely the writer’s opinion.
Solana [SOL] has bullish momentum behind it after a near 10% move upward from the lows of 2 September. At press time, SOL stood at $30.5.
In the same time period, Bitcoin [BTC] has traded sideways within the $19.6k-$19.9k levels. The surge in Solana prices was accompanied by increased demand.
In the futures market, Coinglass data showed a majority of market participants to be positioned long. Can this move upward be sustained, or have the bears woken up to push SOL lower once again?
SOL- 4-Hour Chart
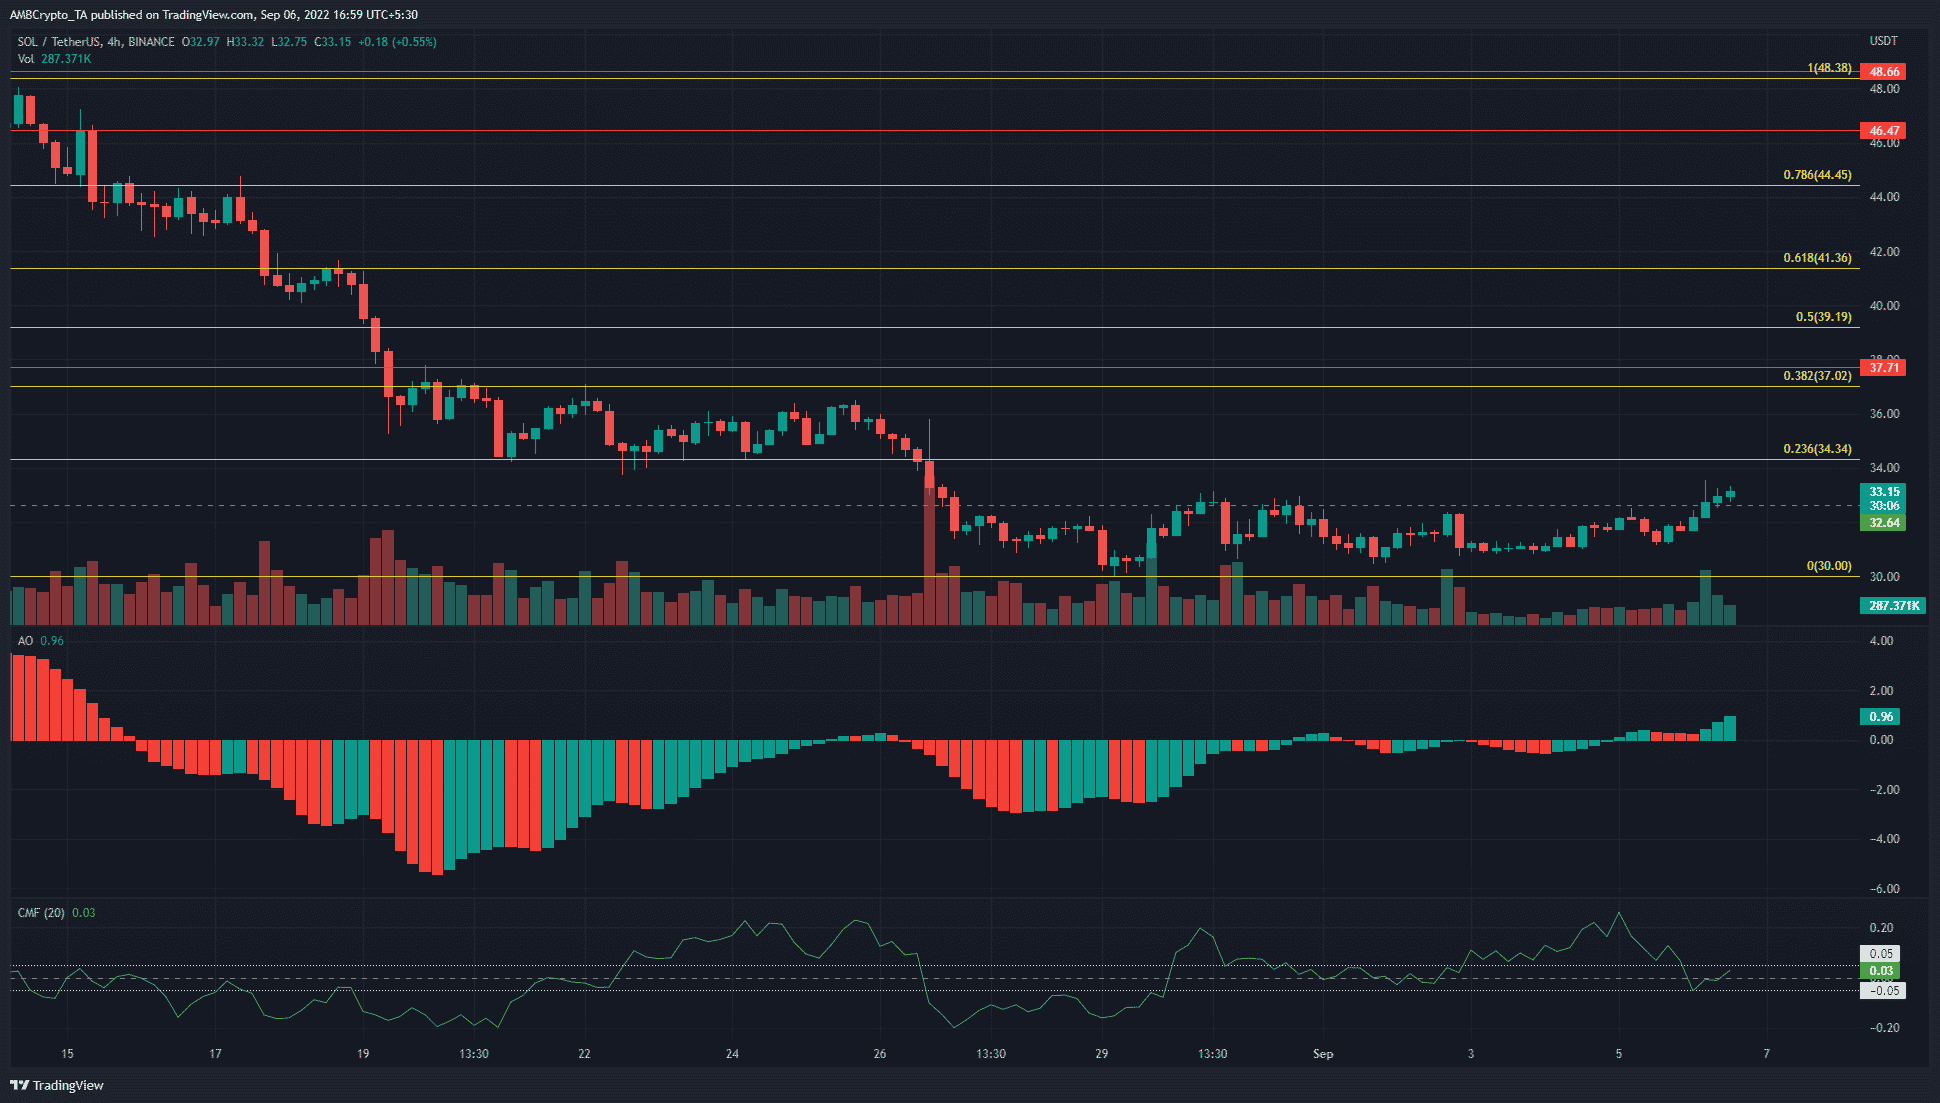
In dotted green, the $32.64 level of former resistance was flipped to support in recent hours. In the past few days, SOL has faced rejection at this level. At the same time, the indicators showed a bullish bias.
The Awesome Oscillator (AO) climbed above the zero line and rise higher in the past 12 hours to show bullish momentum on the rise. The trading volume has also been slightly higher than what it was over the weekend.
The Chaikin Money Flow (CMF) dipped back into neutral territory, after a few days above +0.05.
Well, above +0.05 was indicative of significant capital flow into the market. The Fibonacci retracement levels (yellow) showed some resistance at the $34.34 and $37 levels. Hence, there was the possibility of a move higher.
SOL- 1-Hour Chart
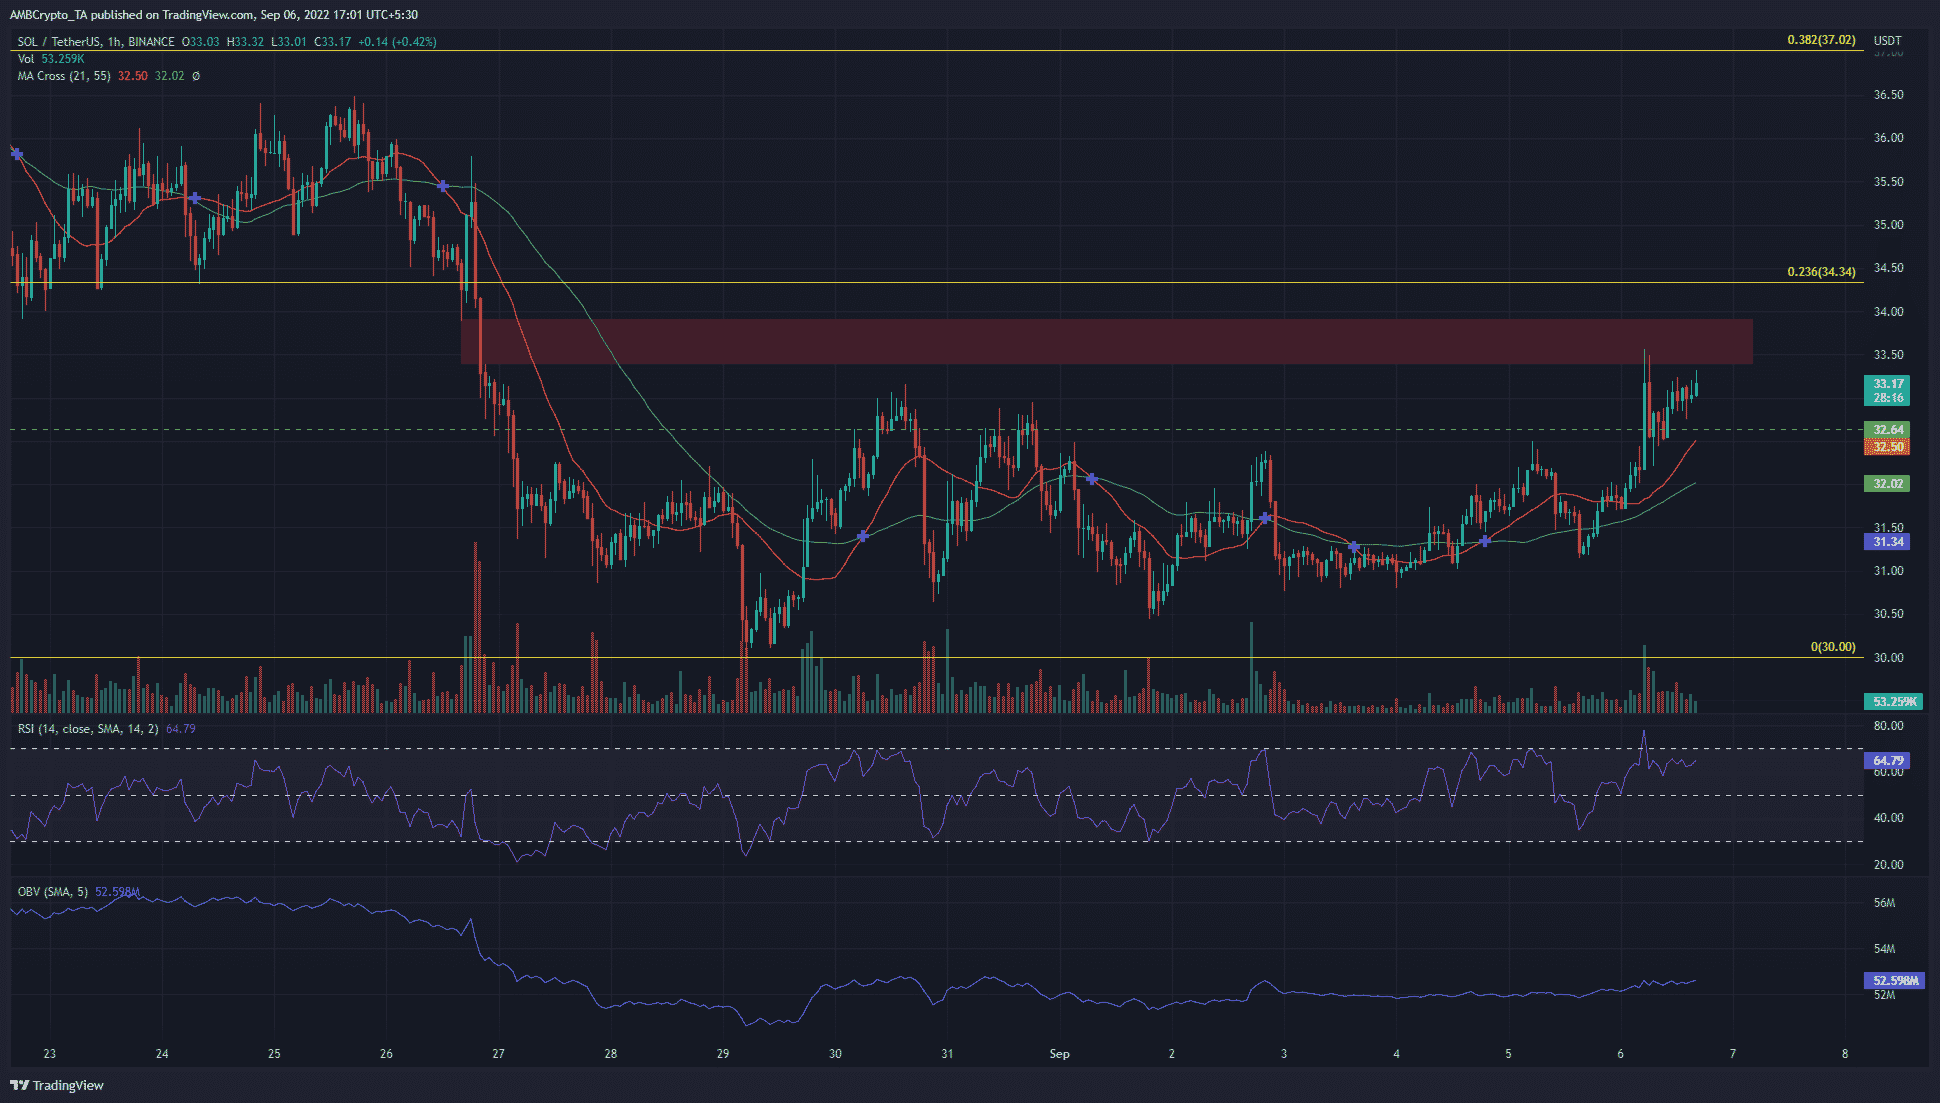
On the one-hour timeframe, the indicators continued to have a bullish outlook. The Relative Strength Index (RSI) stood at 64.74. It has been well above neutral 50 over the past couple of days.
The inference was that short-term momentum was northward and strong. The On-Balance Volume (OBV) also saw a minor uptick over the past couple of days. The 21-period and 55-period moving averages (orange and green respectively) also formed a bullish crossover.
However, the red box highlighted presented a fair value gap. In late August, the price crashed right through this region. At the time of writing, the price approached this region. Despite the momentum, the price could see a bearish reversal in this region. Such a reversal could send SOL back to the $31 mark.
Conclusion
The $34 region as well as the $34.34 Fibonacci retracement level both presented a significant resistance for Solana bulls. If Bitcoin can climb past the $20.2k and the $20.8k levels in the next few days, a bullish scenario could develop for SOL.
This could see both the $34 belt flipped to a demand zone. Until such a scenario, buying SOL beneath the $34 mark could be a risky venture.