Solana indicators show low demand – Should you be worried?
The OBV and the CMF volume indicators gave traders a pause, but the bullish conviction could drive prices higher.

- Solana has breached an imbalance on the daily chart and could retest it as a support zone.
- The momentum and price action signaled bulls were in control of the market.
Solana [SOL] saw a spike in the non-fungible token trading volume. A recent AMBCrypto report revealed that the Solana-based NFT volume increased 30% in the 24 hours that preceded press time, but that its month-to-month volume was still down 57% compared to April.
Technical analysis of the token showed that a $200 target was feasible. The bullish outlook remained strong, but the volume indicators continued to cast a slight doubt on the breakout.
The incongruence of the volume indicators
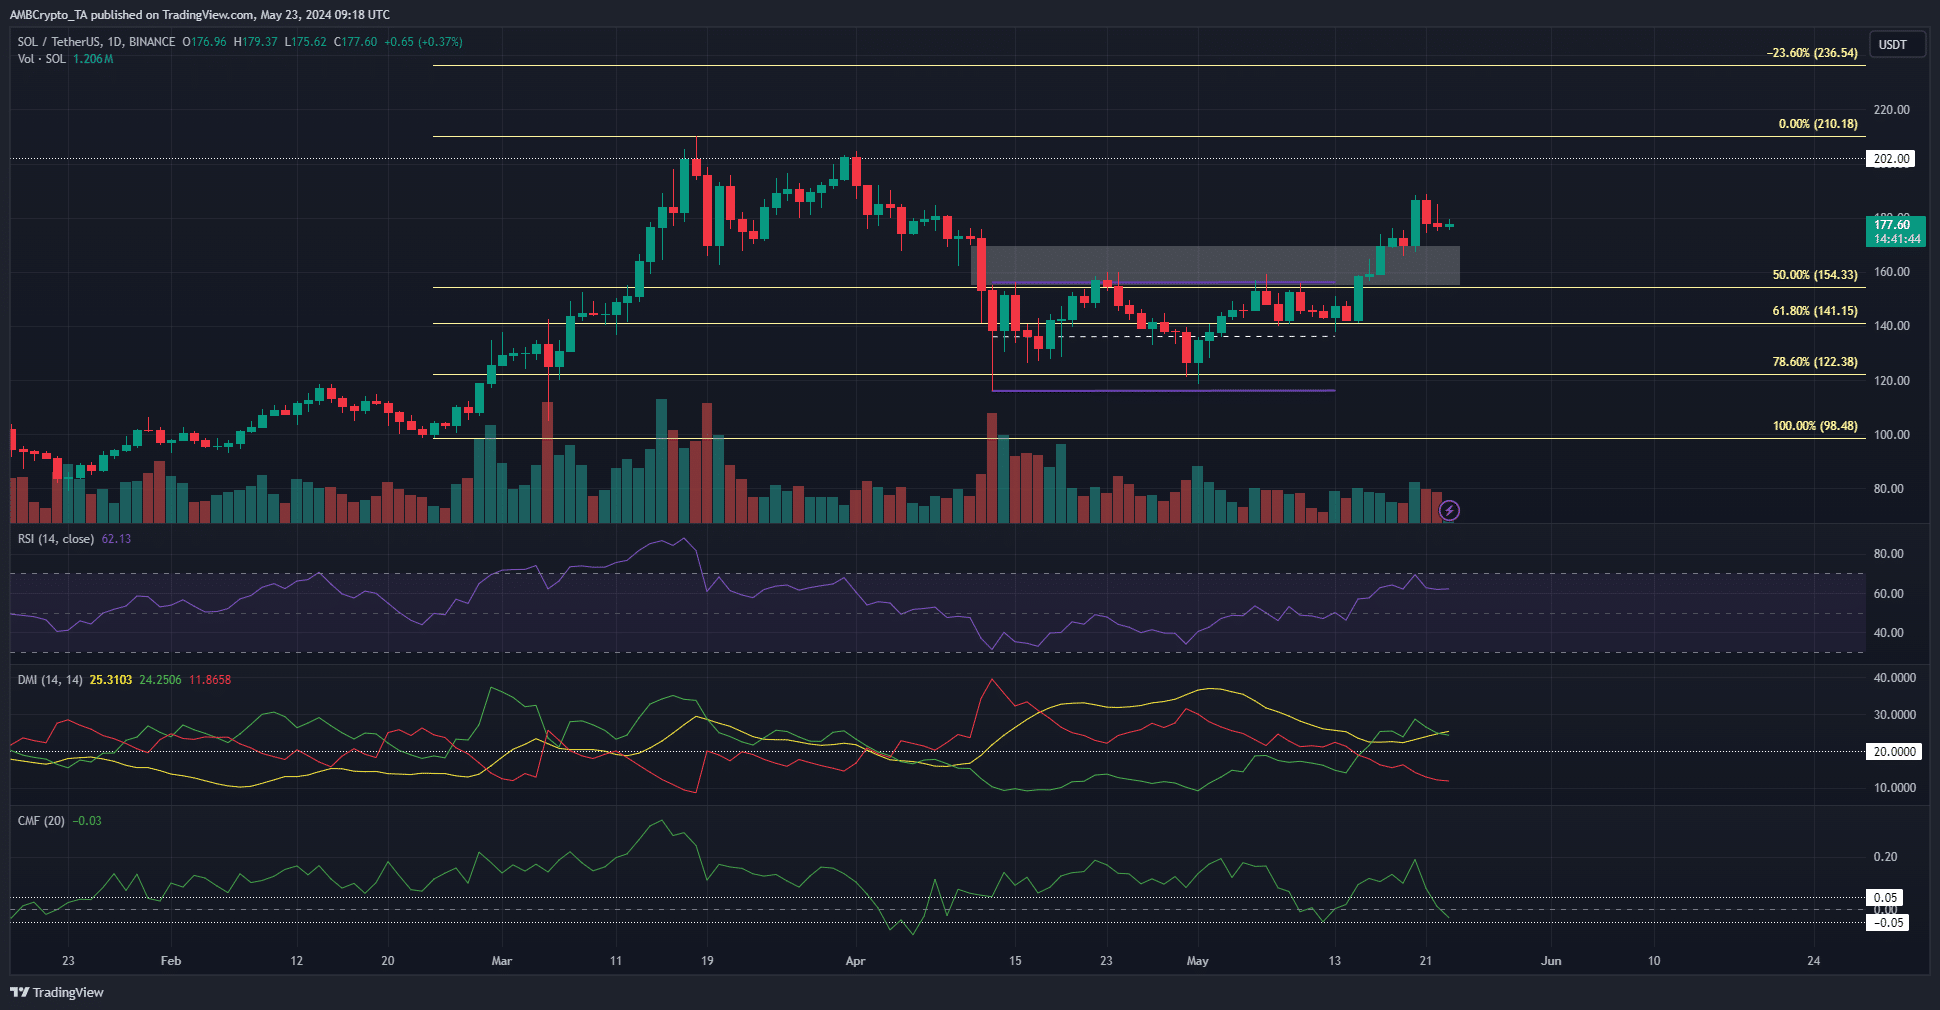
In a previous price analysis, AMBCrypto noted that the OBV had not made a move past the local resistance despite the price rally. The Fibonacci extension levels at $236 and $279 are the next targets, but the lack of a bullish follow-through could be a sign of weakness.
The trading volume did not surge higher despite the break of a six-week resistance zone. The CMF sunk toward -0.05. Its reading of -0.03 at press time showed no significant capital flow into or out of the SOL market.
This was worrying because ideally a breakout should be accompanied by increased buying pressure.
Therefore, SOL might sink below the $160 zone again. It was not likely at press time, given the momentum indicators and the price action itself. The Directional Movement Index showed a strong uptrend with both the +DI and ADX above the 20 mark.
Spot demand was another reason why Solana is expected to continue its rally
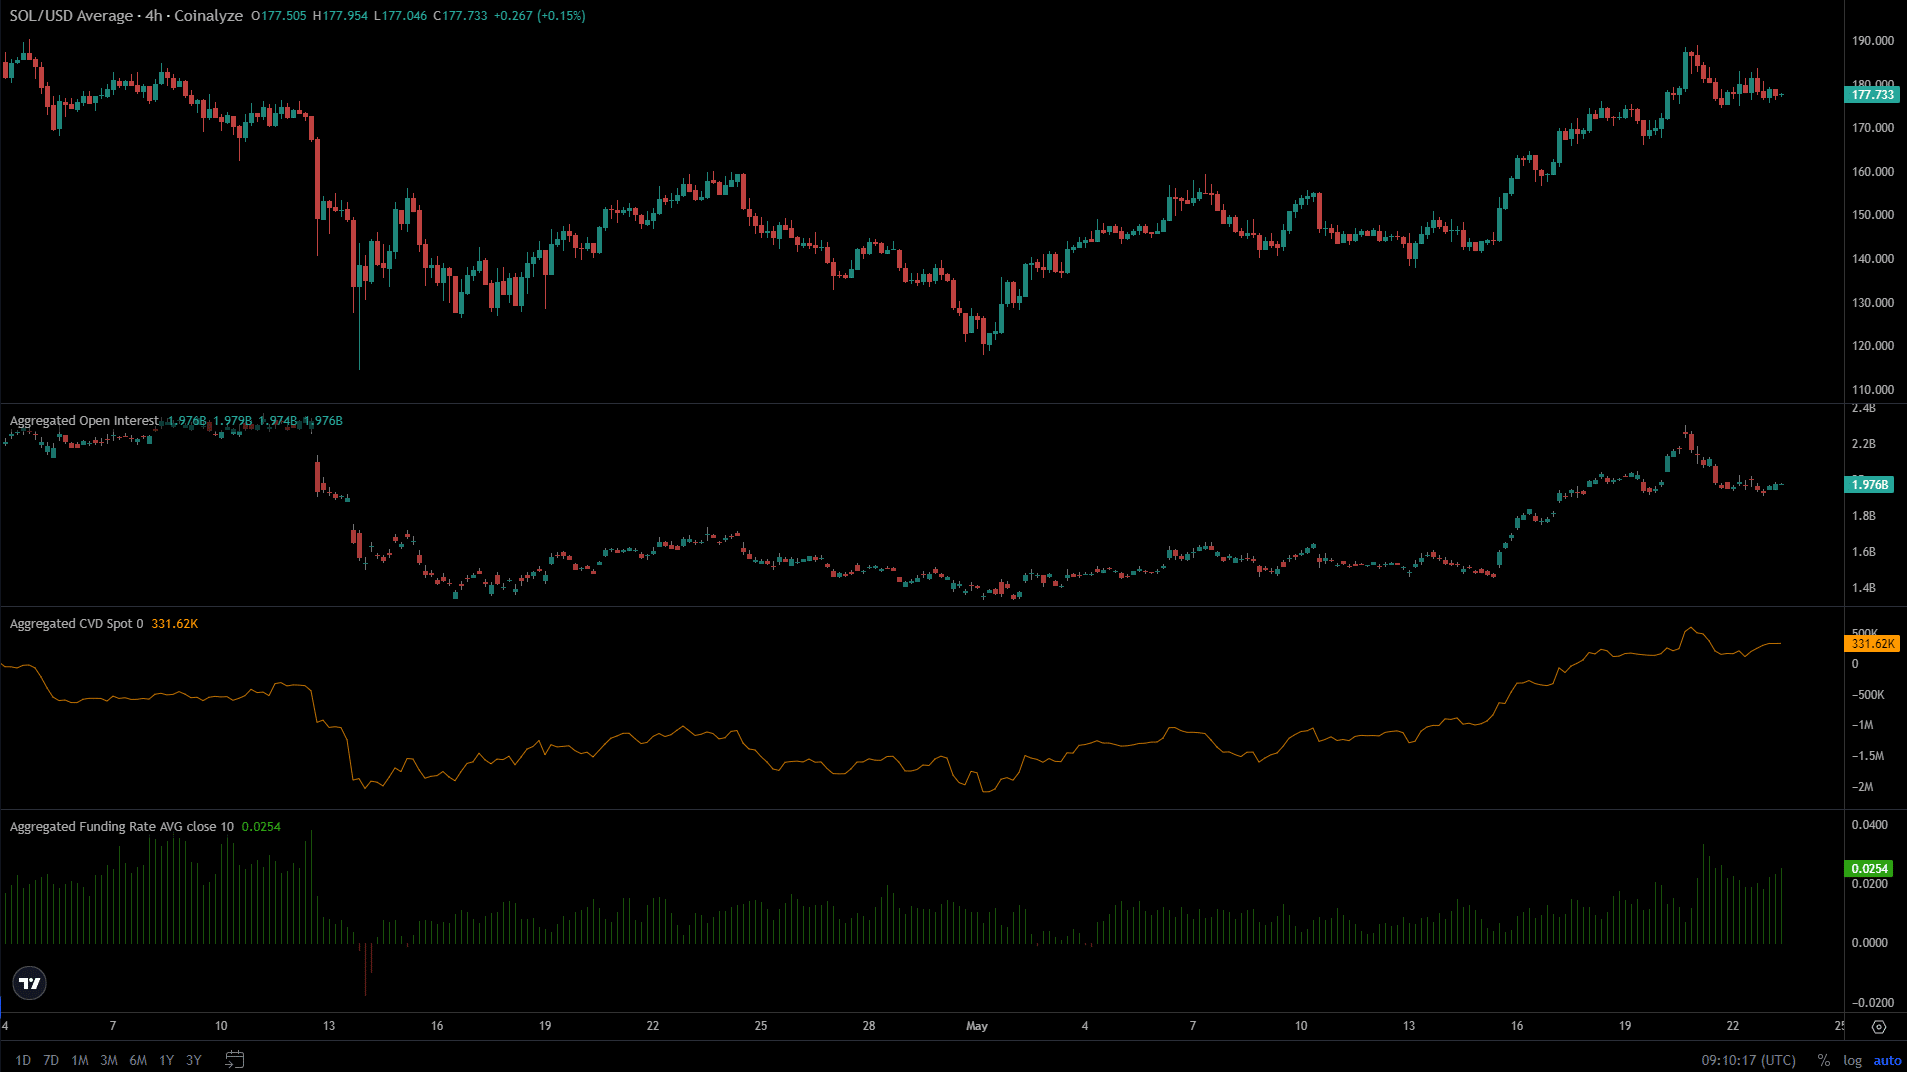
The OBV and the CMF volume indicators gave traders a pause, but the spot CVD and the Open Interest highlighted bullish conviction amongst market participants. The OI swiftly during the breakout to indicate increased bullish speculation.
Is your portfolio green? Check the Solana Profit Calculator
The funding rate was also growing more positive to showcase an increased number of traders opting to go long. The spot CVD’s uptrend was a sign of genuine demand behind the rally.
Therefore, the $160 support zone would likely be defended in the event of a retest and the rally is expected to continue.
Disclaimer: The information presented does not constitute financial, investment, trading, or other types of advice and is solely the writer’s opinion.


