Solana: Predicting SOL’s likely response to this resistance range

Disclaimer: The findings of the following analysis are the sole opinions of the writer and should not be considered investment advice.
- Solana approached its three-week resistance mark. Can it induce a near-term rally?
- The altcoin witnessed an uptick in its funding rates
- The long/short ratio revealed a slight bearish edge in the short term
Solana’s [SOL] immediate ceiling in the $34-zone has constrained the buying pressure for the last three weeks. As the bulls strive to retest this resistance again, SOL could present an opportunity in the coming sessions.
Here’s AMBCrypto’s Price Prediction for Solana [SOL] for 2023-24
As observed empirically, reversals from this ceiling have reignited short-term selling pressure.
Meanwhile, the two-week-long trendline support flipped to resistance on the four-hour timeframe. At press time, SOL was trading at $34.0475 on the price charts.
SOL noted a golden cross, can it sustain a bullish edge?
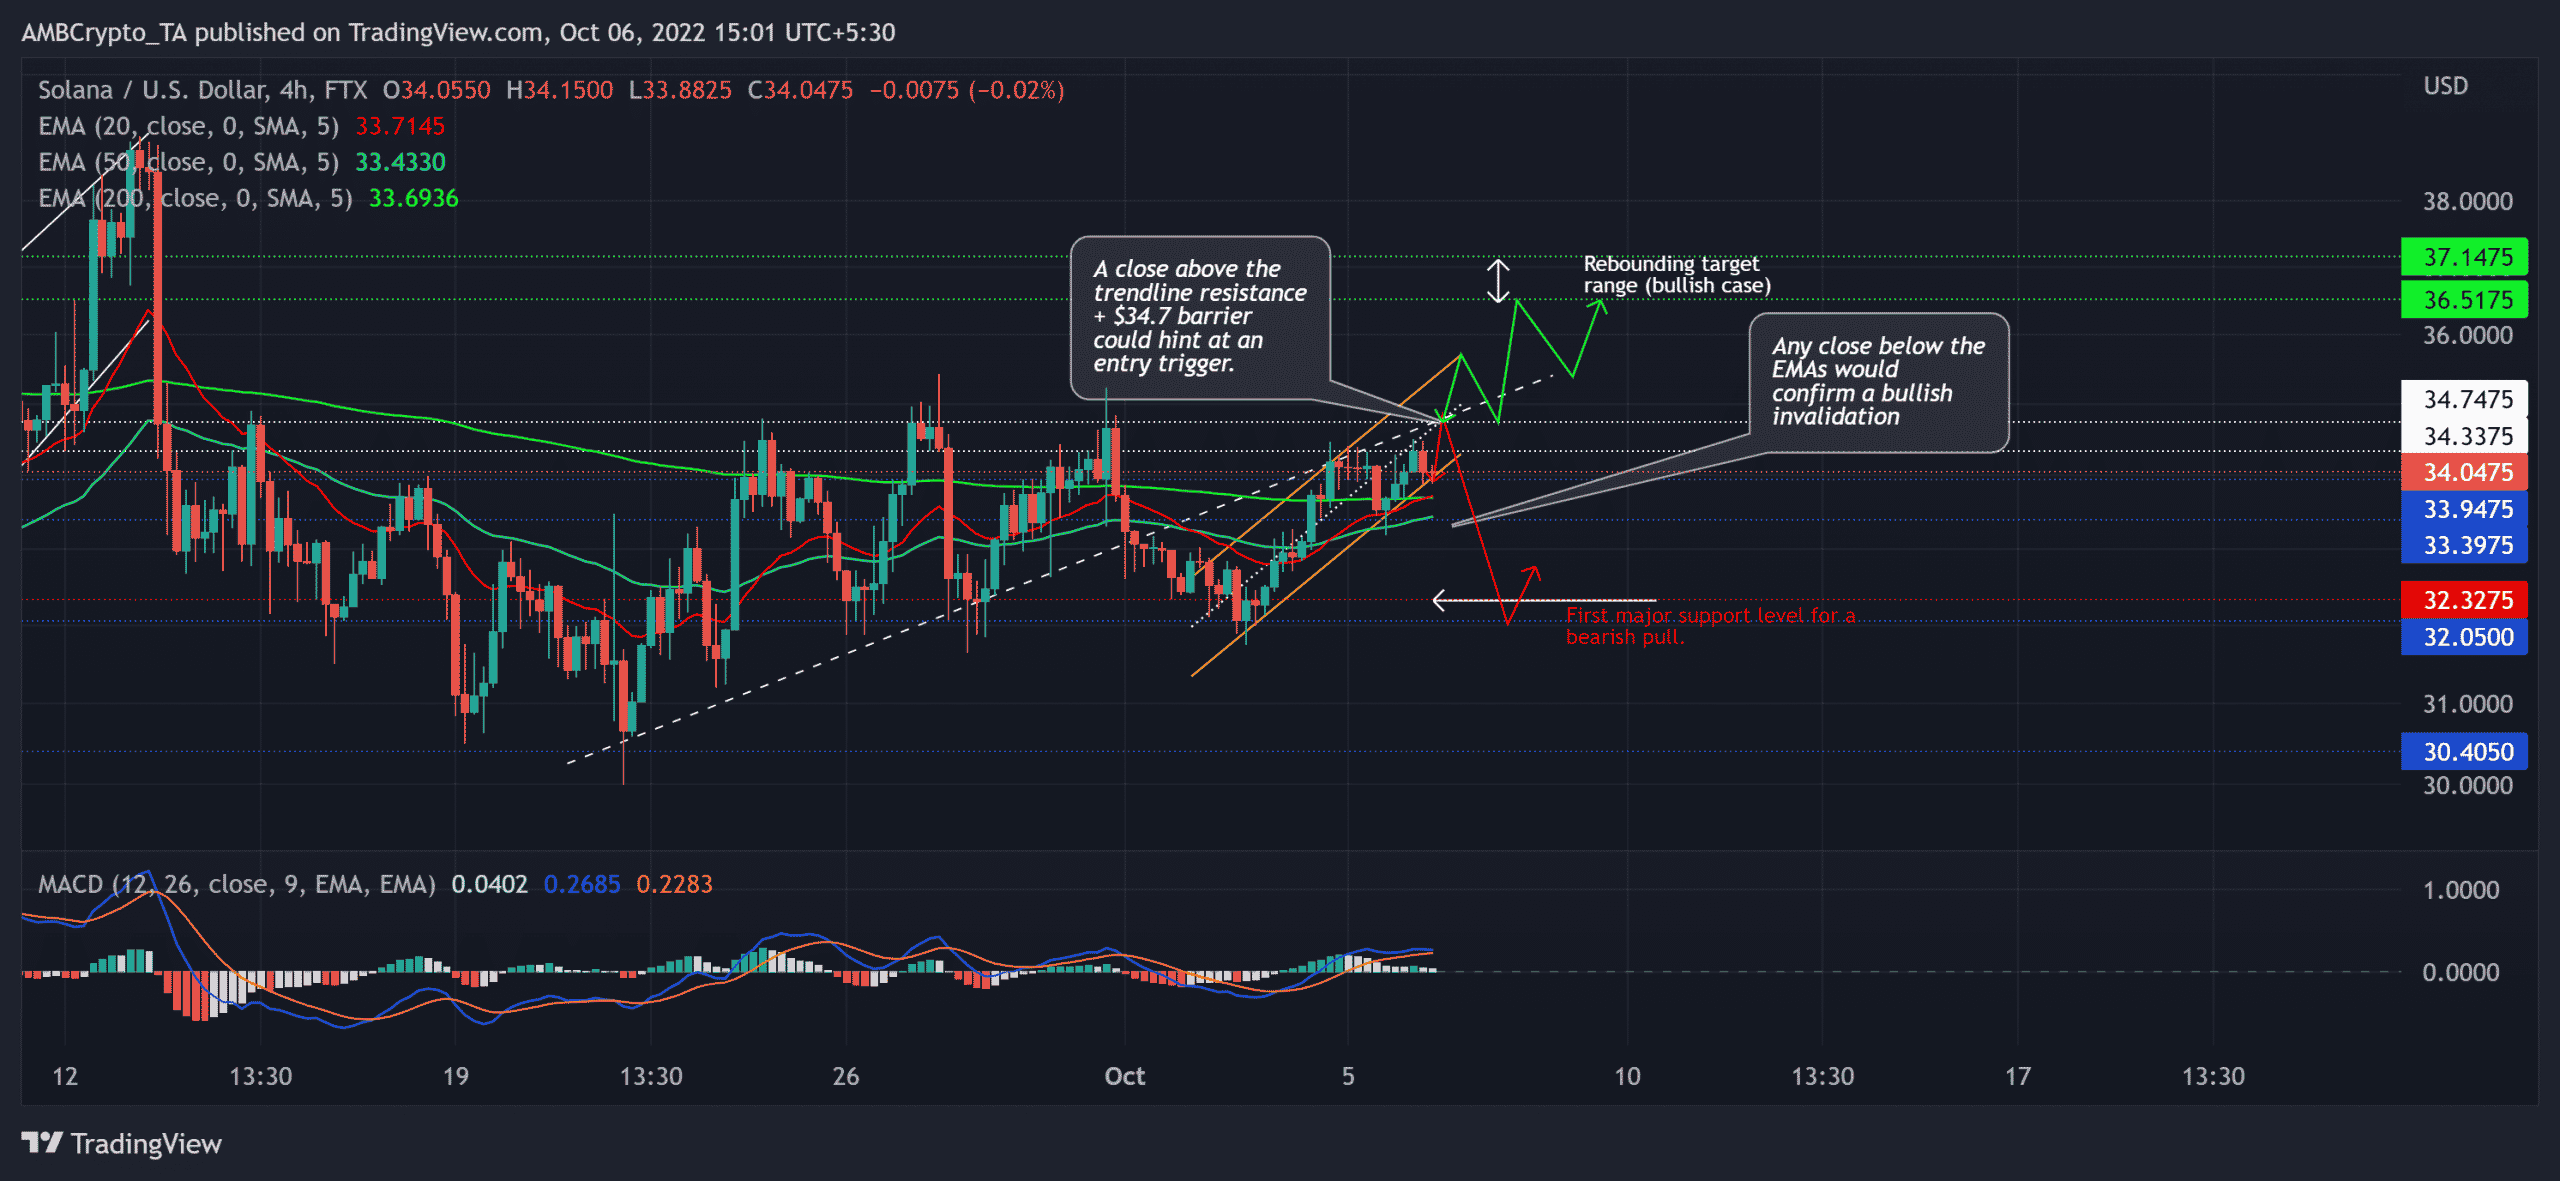
SOL’s recent reversals from the $34-mark have pulled the alt towards the $32 baseline support. The altcoin’s latest rebound from this support level has chalked out an ascending channel on the four-hour chart.
As a result, SOL swayed above the limitations of the 20 EMA (red), 50 EMA (cyan), and 200 EMA (green) to unveil a slight bullish edge. The only question is – Can it sustain this edge?
An analysis of the previous golden crossovers for SOL revealed more often than not that these crossovers entail a near-term bull run.
A potential break above the $34.7-level could provoke a short-term bull run in the coming sessions. The buyers would look to push the prices towards the $36-$37 range before a likely bearish rebuttal.
Nonetheless, a sustained break below the $33.9-level would affirm an up-channel breakdown. In such a case, a decline below the EMAs could position SOL for retesting its first major support level in the $32-zone.
The Moving Average Convergence Divergence (MACD) held its spot above the zero-mark to project a buying edge. The buyers should look for a potential bearish crossover leading to a decline below its equilibrium to gauge bullish invalidation.
Funding rates witness an uptick
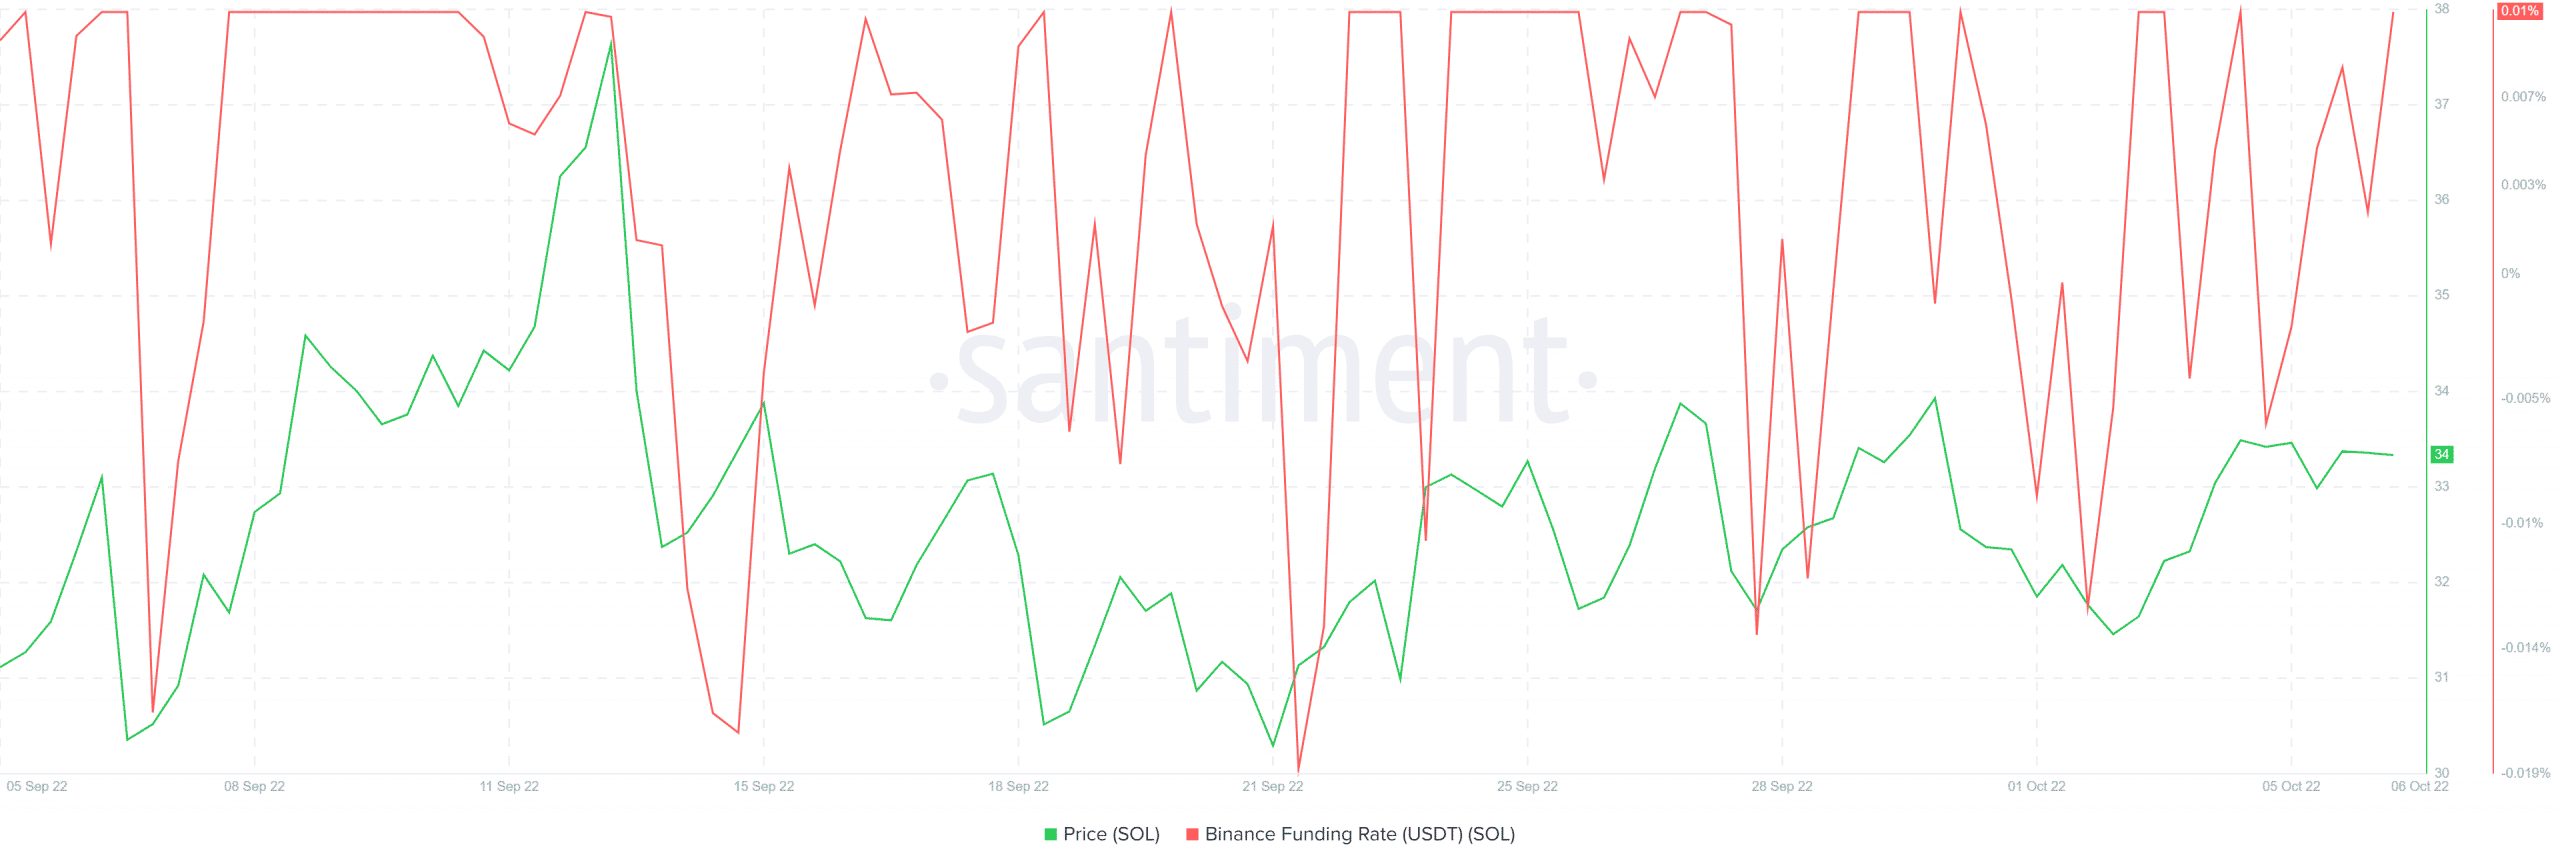
The funding rates turned positive on Binance over the last 24 hours, according to data from Santiment. In essence, the metric hinted that most traders were bullish on the Futures market.
However, the price action over the last two days was yet to reflect this sentiment at press time.

On the other hand, an analysis of the long/short ratio revealed a rather neutral-ish position over the last 24 hours. Over the past four hours, however, SOL revealed an inclination for more short positions.
Finally, SOL’s approach towards its near-term ceiling has spurred mixed investor sentiment. But the triggers and targets would remain the same as discussed above. Importantly, investors/traders must keep a close eye on Bitcoin’s [BTC] movement to determine its effects on the broader sentiment.