Solana pushes towards $115 but here are some levels that can act as roadblocks

Disclaimer: The findings of the following analysis are the sole opinions of the writer and should not be considered investment advice
Has Solana broken the long-term bear trend? Technically, not yet. The highs at $106.4 and the band of supply at $120 could offer resistance to the bullish advance. Price is always attracted to liquidity, and the bullishness of the crypto market and particularly Bitcoin could see Solana push higher up the charts as well. Just above $120 is an attractive pocket of liquidity- can SOL push that high in the coming weeks, and what are the possible outcomes as things currently stand?
SOL- 1D
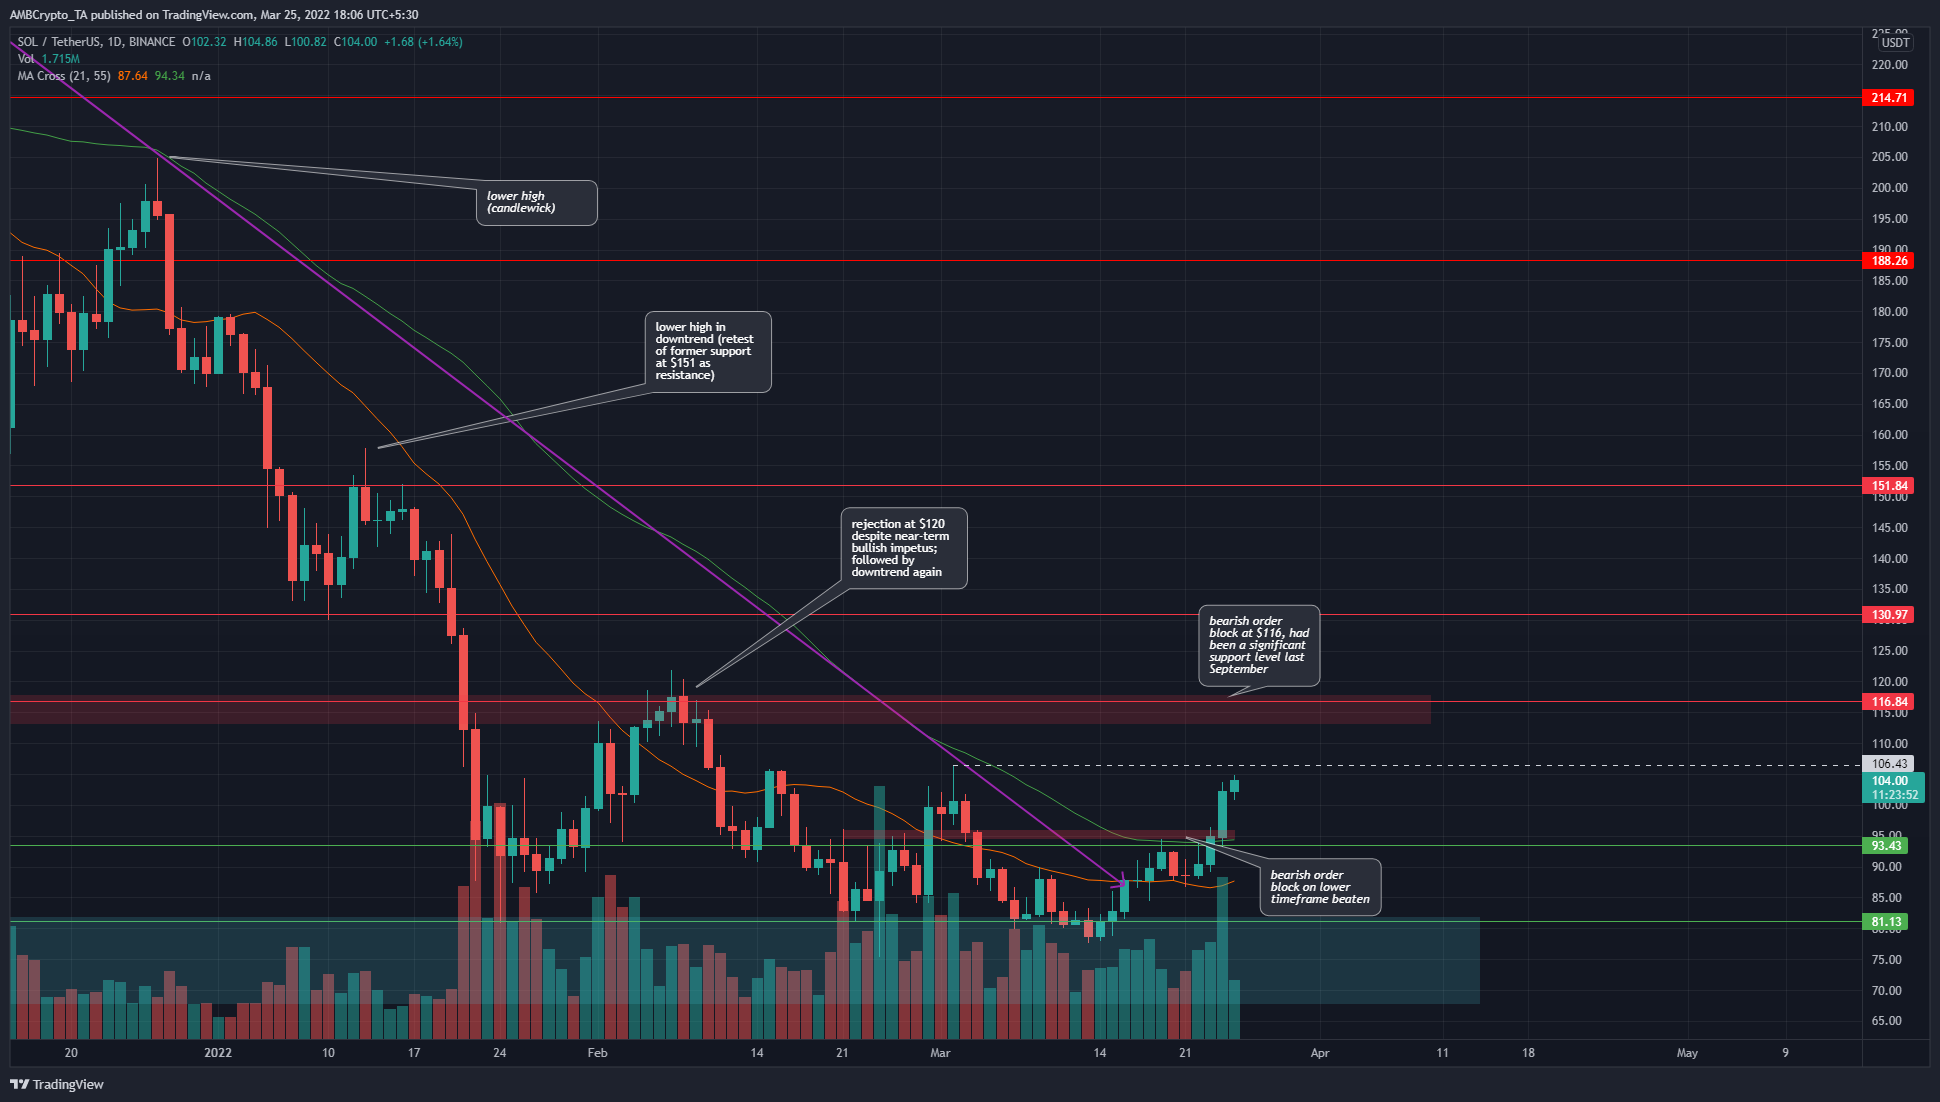
On the daily chart, the $106.4 and the $120 area are important as they represent recent lower highs on the downtrend of SOL. On lower timeframes, the bearish order block at $93-$95 has already been beaten and flipped to a demand zone.
The 21 and 55 period moving averages had not yet made a bullish crossover on the daily chart- but the market structure could shift toward the bulls should price break above $106 and register a higher low in the next week.
Would SOL be able to break past $120? It was possible, especially because it represented an area where buyers looking to buy the “flip of $120 to demand” could be trapped. Such trapped longs would provide further fuel if the price were forced back below $120.
Moreover, it was unlikely that SOL would be able to push past such a significant resistance area in one go.
Rationale
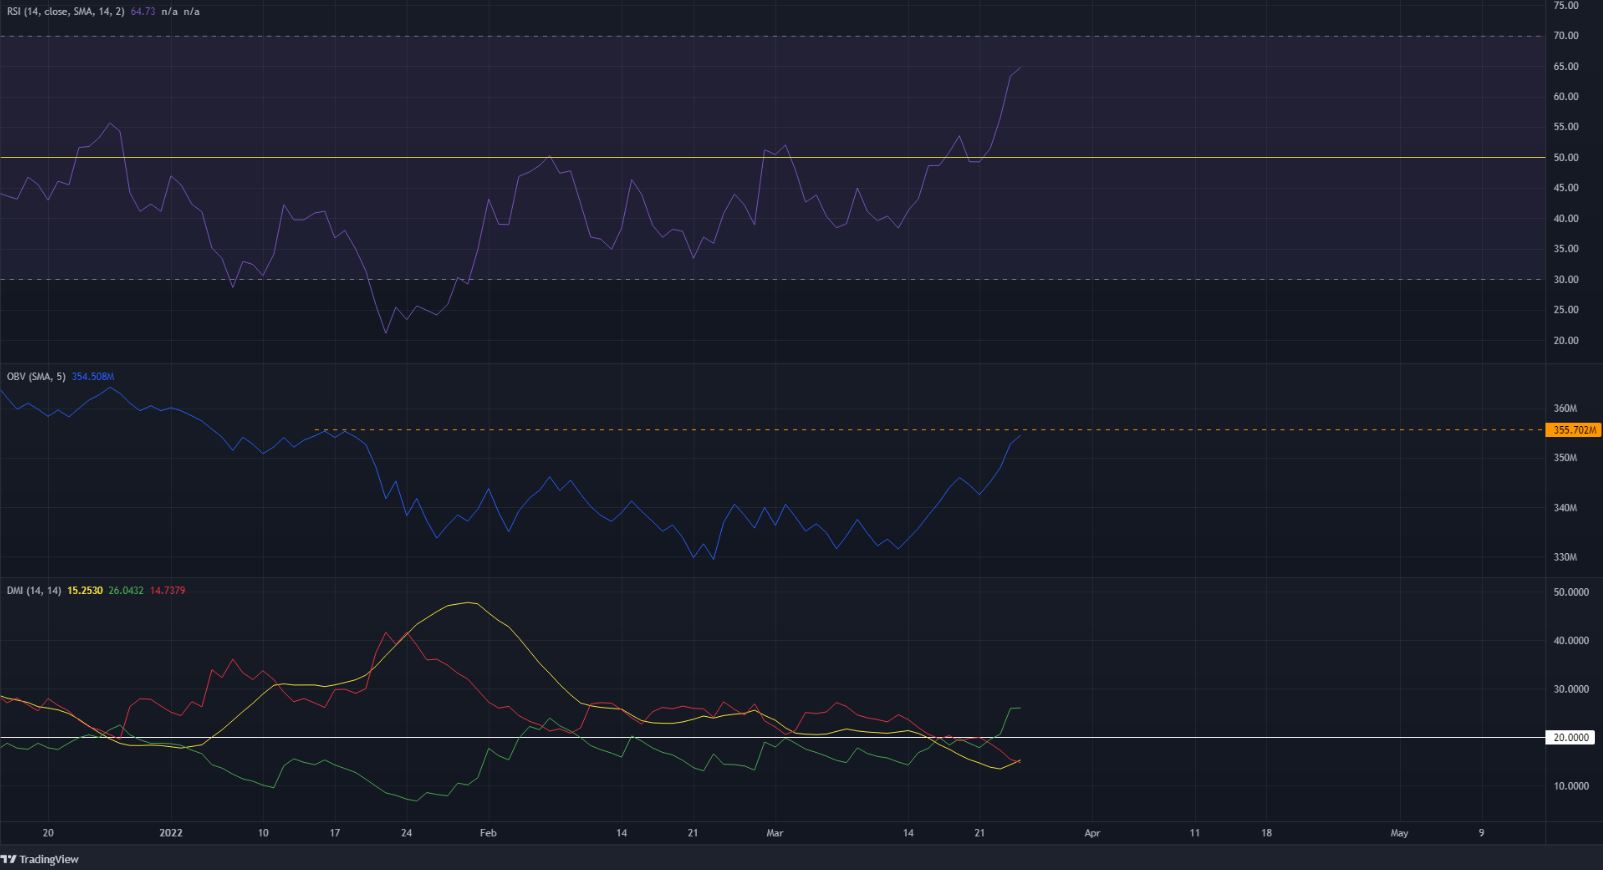
The RSI broke above neutral 50 once again and retested it as support, a first since mid-November. It stood at 64.72 to denote strong bullish momentum.
The OBV has not yet risen above the downtrend’s lower high, to signal that the selling volume in recent months was being undone. This could take some time to develop. Similarly, the DMI did not yet indicate a strong uptrend in progress as the ADX was only at 15.2.
Conclusion
Bitcoin would likely have a huge say in the market sentiment, and it approaches resistance at $46k. Some volatility could be seen in the next few days but it is expected that Bitcoin can push higher in the next few weeks. Similarly, SOL could also register gains, but the $120 area remains a resistance zone to watch out for.


