Solana rallies 27% in 6 days – Will $160 price level fall next for SOL?
On the higher timeframes, the structure of Solana was bullish. Will SOL reach $210 next?
- Solana did not see added buying pressure despite its impressive 27.2% bounce in the past six days.
- Despite the shift in momentum, the range is expected to persist.
Solana [SOL] was at the range highs of the past month once more. The stern resistance near the $160 region appeared likely to rebuff the bullish efforts.
News that the Solana network NFT sales were booming was an added positive for users.
It suggested the possibility of a price appreciation due to increased demand. However, despite the short-term bullish price action in the past few days, a retracement could be around the corner.
The month-long range and the $160 zone
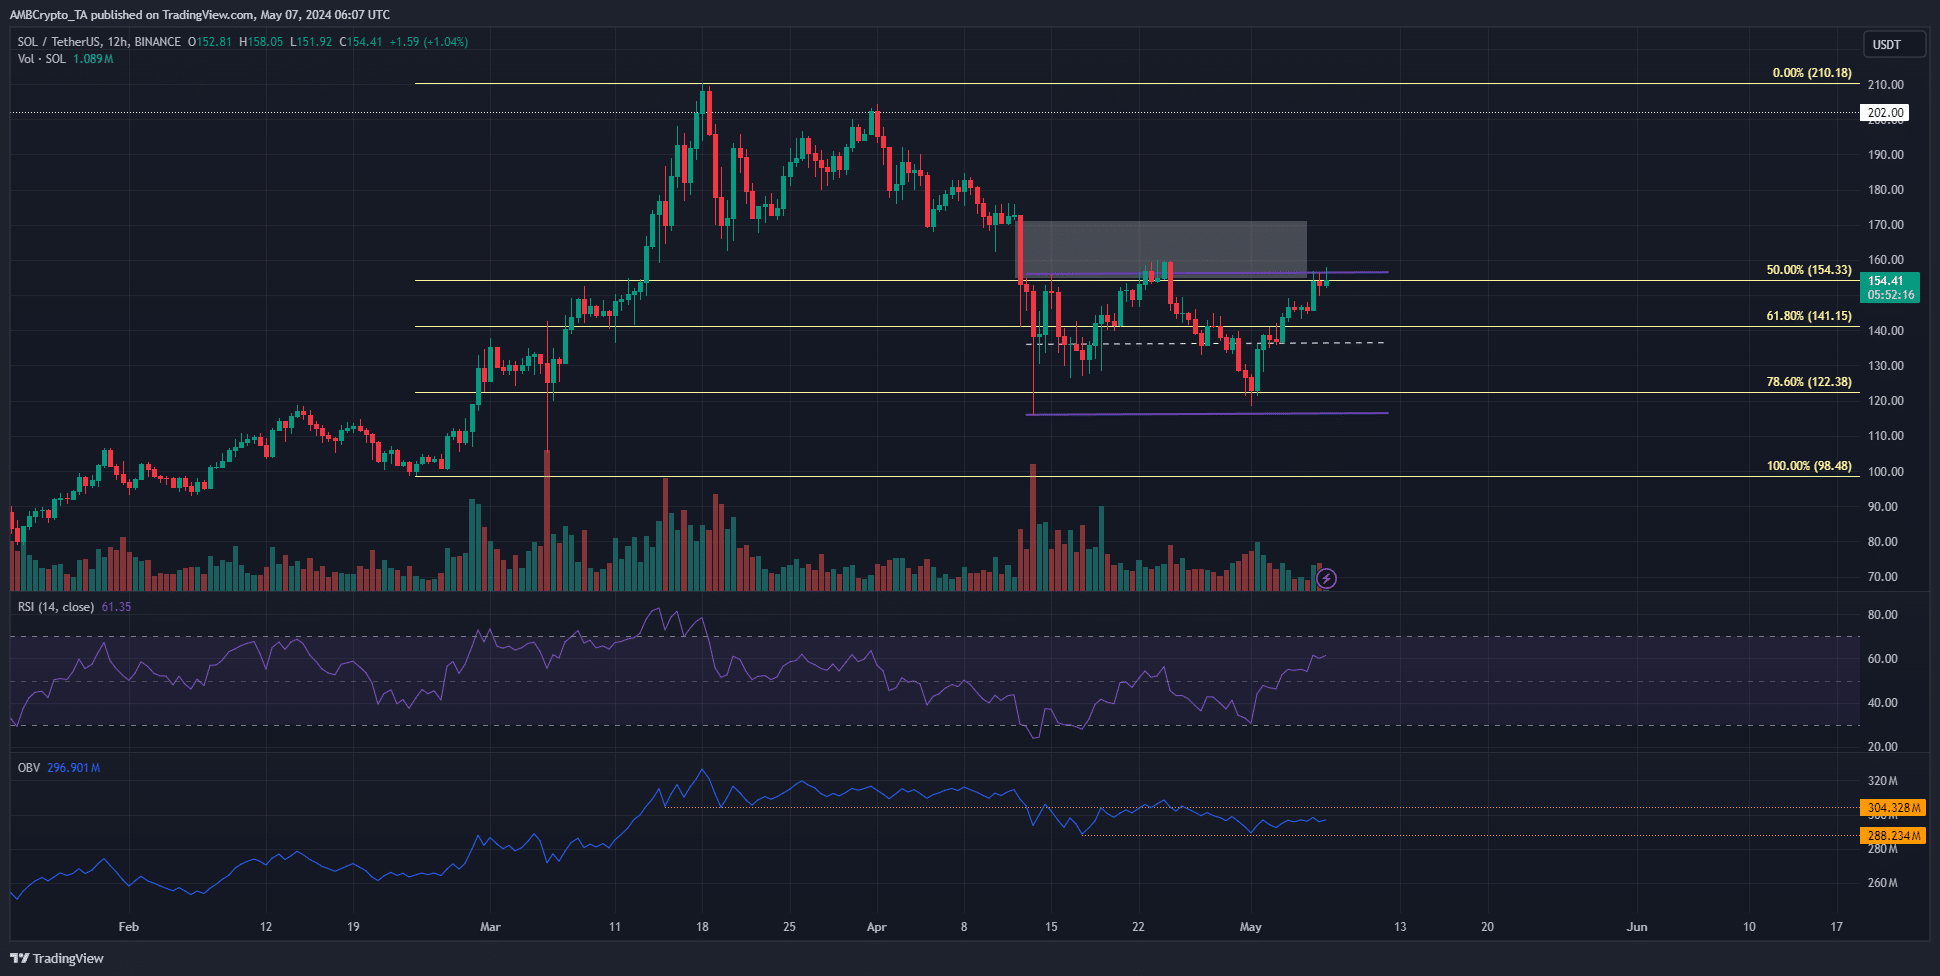
On the 12-hour chart, the structure of Solana was bullish. It retraced from the highs at $210 to the 78.6% Fibonacci retracement level at $122 in April.
The internal, lower timeframe structure was bearish at press time.
The imbalance (white box), also known as the fair value gap, coincided with the range (purple) highs. This range extended from $116 to $156. AMBCrypto expected a price rejection from this resistance.
The OBV has not cleared the resistance level overhead and did not signal strong buying pressure. Meanwhile, the RSI reflected the bullish momentum of the past week with its reading of 61.
The cluster of liquidity could cause short-term volatility
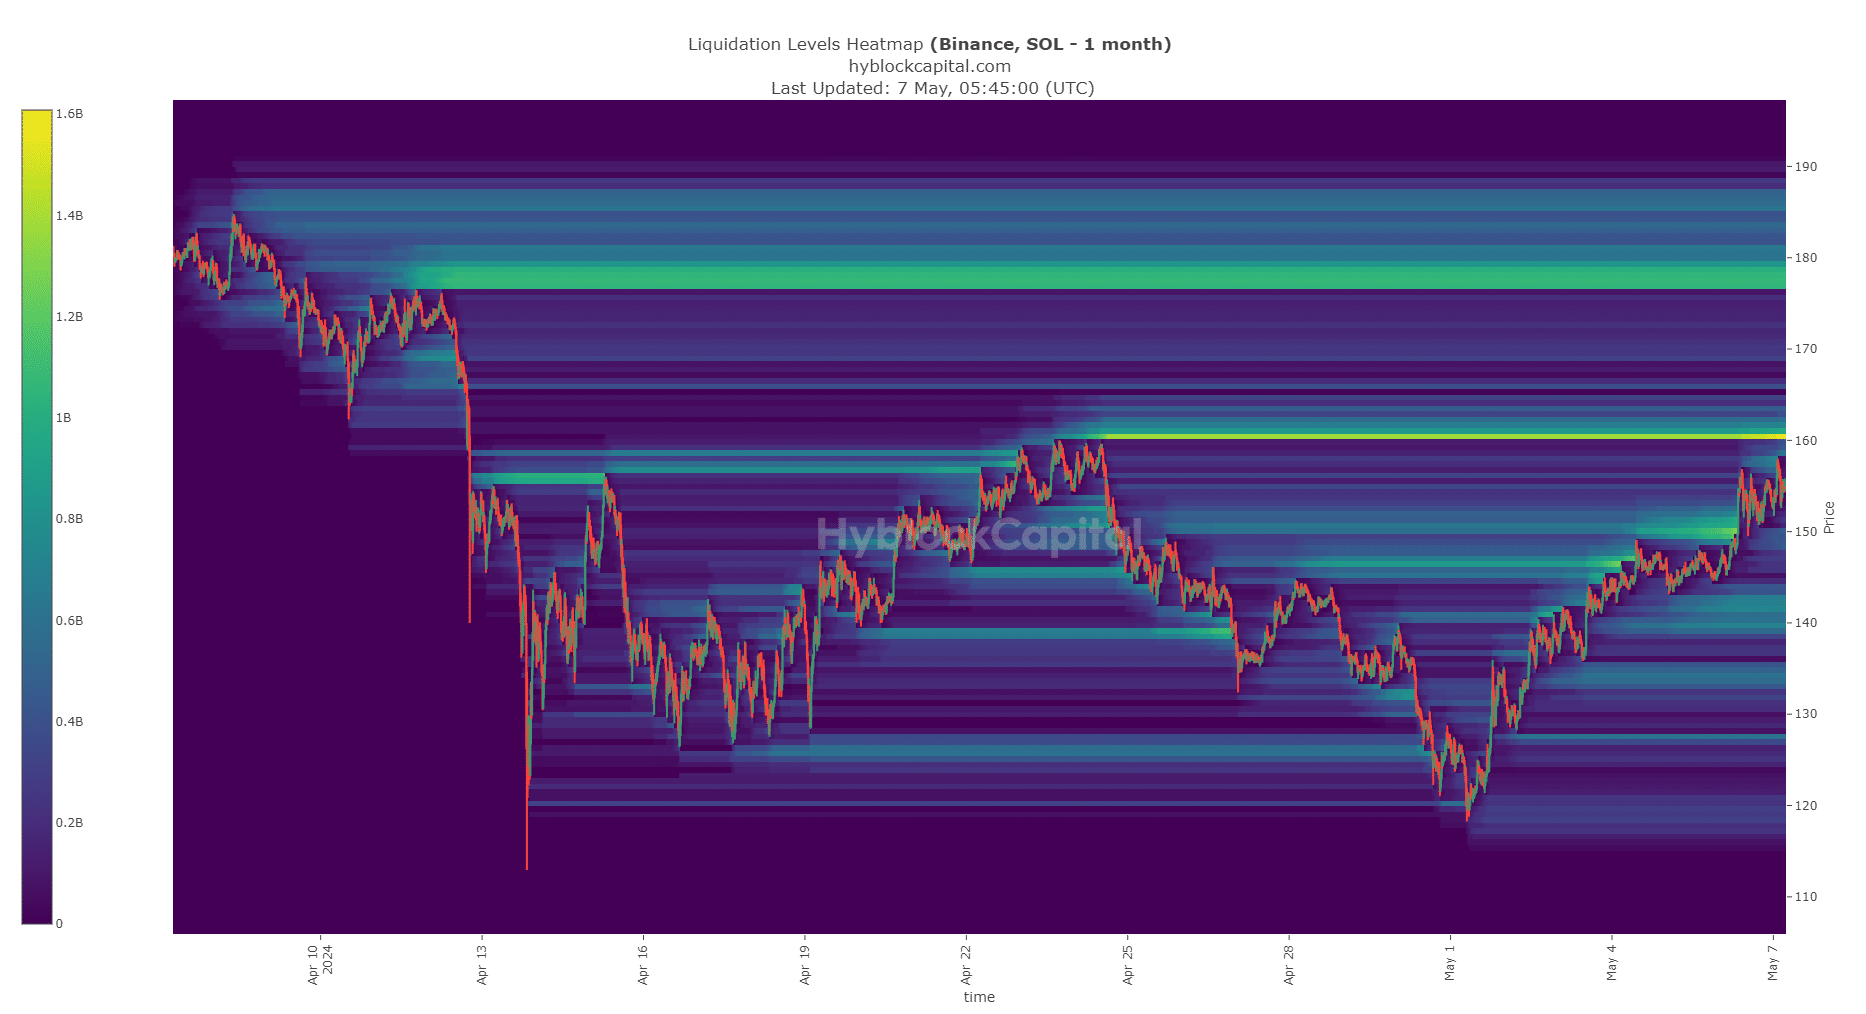
The liquidation levels data from Hyblock showed AMBCrypto that the $160.4 level was an area of interest. It is very likely to attract SOL prices to it.
Is your portfolio green? Check out the SOL Profit Calculator
Once reached, the forced market buy orders could momentarily sweep SOL higher than $160.
This could cause volatility before the prices fall back within the range. Alternatively, a move above the $165-$170 region would be a sign that the bulls were dominant.
Disclaimer: The information presented does not constitute financial, investment, trading, or other types of advice and is solely the writer’s opinion.


