Solana [SOL] investors’ worry might not end anytime soon because…
![Solana [SOL] investors’ worry might not end anytime soon because...](https://ambcrypto.com/wp-content/uploads/2022/11/dm-4-fi-e1668167453633.jpg)
- Solana’s NFT ecosystem registered a growth last week
- SOL’s funding rate spiked only to go down later
Solana’s [SOL] recent performance gave chills to the investors as its price dropped drastically. This cost SOL its spot on the top 10 list. However, Solana recently showed growth in its NFT space, which might help SOL reclaim its previous position and register more greens on its price chart.
Solana NFT Highlights Week 45
🔸 @Stepnofficial + ASICS Airdrop
🔸The @Solana NFT Celebration Contest on @instagram
🔸@MagicEden Launchpad now supports SFTs launches
(1/2) pic.twitter.com/Kg7ynWNAdb
— Solana Daily (@solana_daily) November 9, 2022
Read Solana’s [SOL] Price Prediction 2023-24
These NFT highlights include Magic Eden’s recent update, which was a launchpad supporting SFTs, the Solana NFT celebration contest on Instagram, Genopets v0.4.0 going live in the App Store, and more.
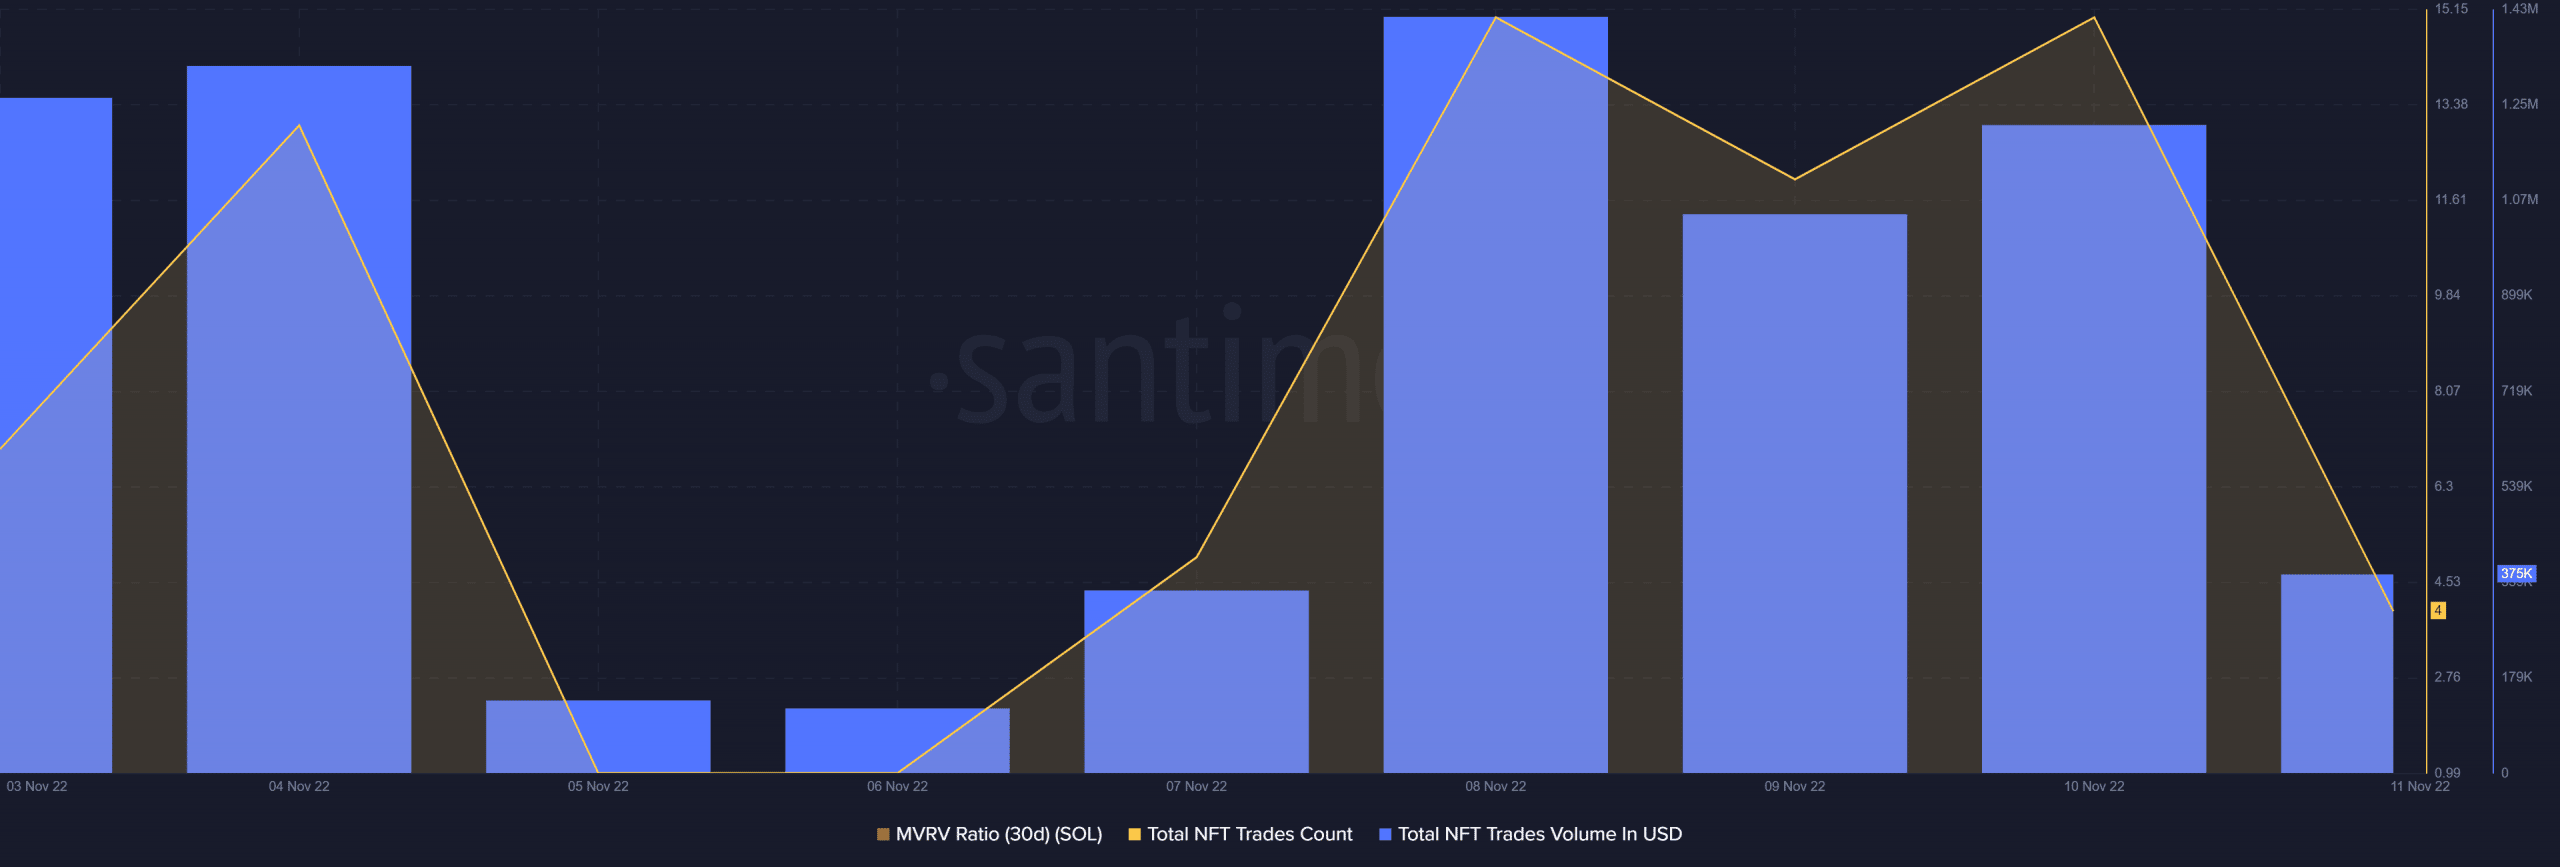
Additionally, Santiment’s chart revealed that metric growth was noticeable for Solana’s NFT ecosystem as well. Solana’s total NFT trade count increased sharply last week, as did its total NFT trade volumes in USD.
This was a positive development because it showed that more transactions were taking place on the network.
Is a revival coming soon for SOL?
Solana’s recent uptick and the growth in its NFT space gave rise to optimism. At press time, SOL’s price was up by over 23% in the last 24 hours and was trading at $17.40 with a market capitalization of more than $6.32 billion.
Interestingly, several on-chain metrics also revealed a similar possibility of a continued price surge in the coming days. For instance, CryptoQuant’s data pointed out that SOL’s price was in an oversold position, which is a massive bullish indicator.
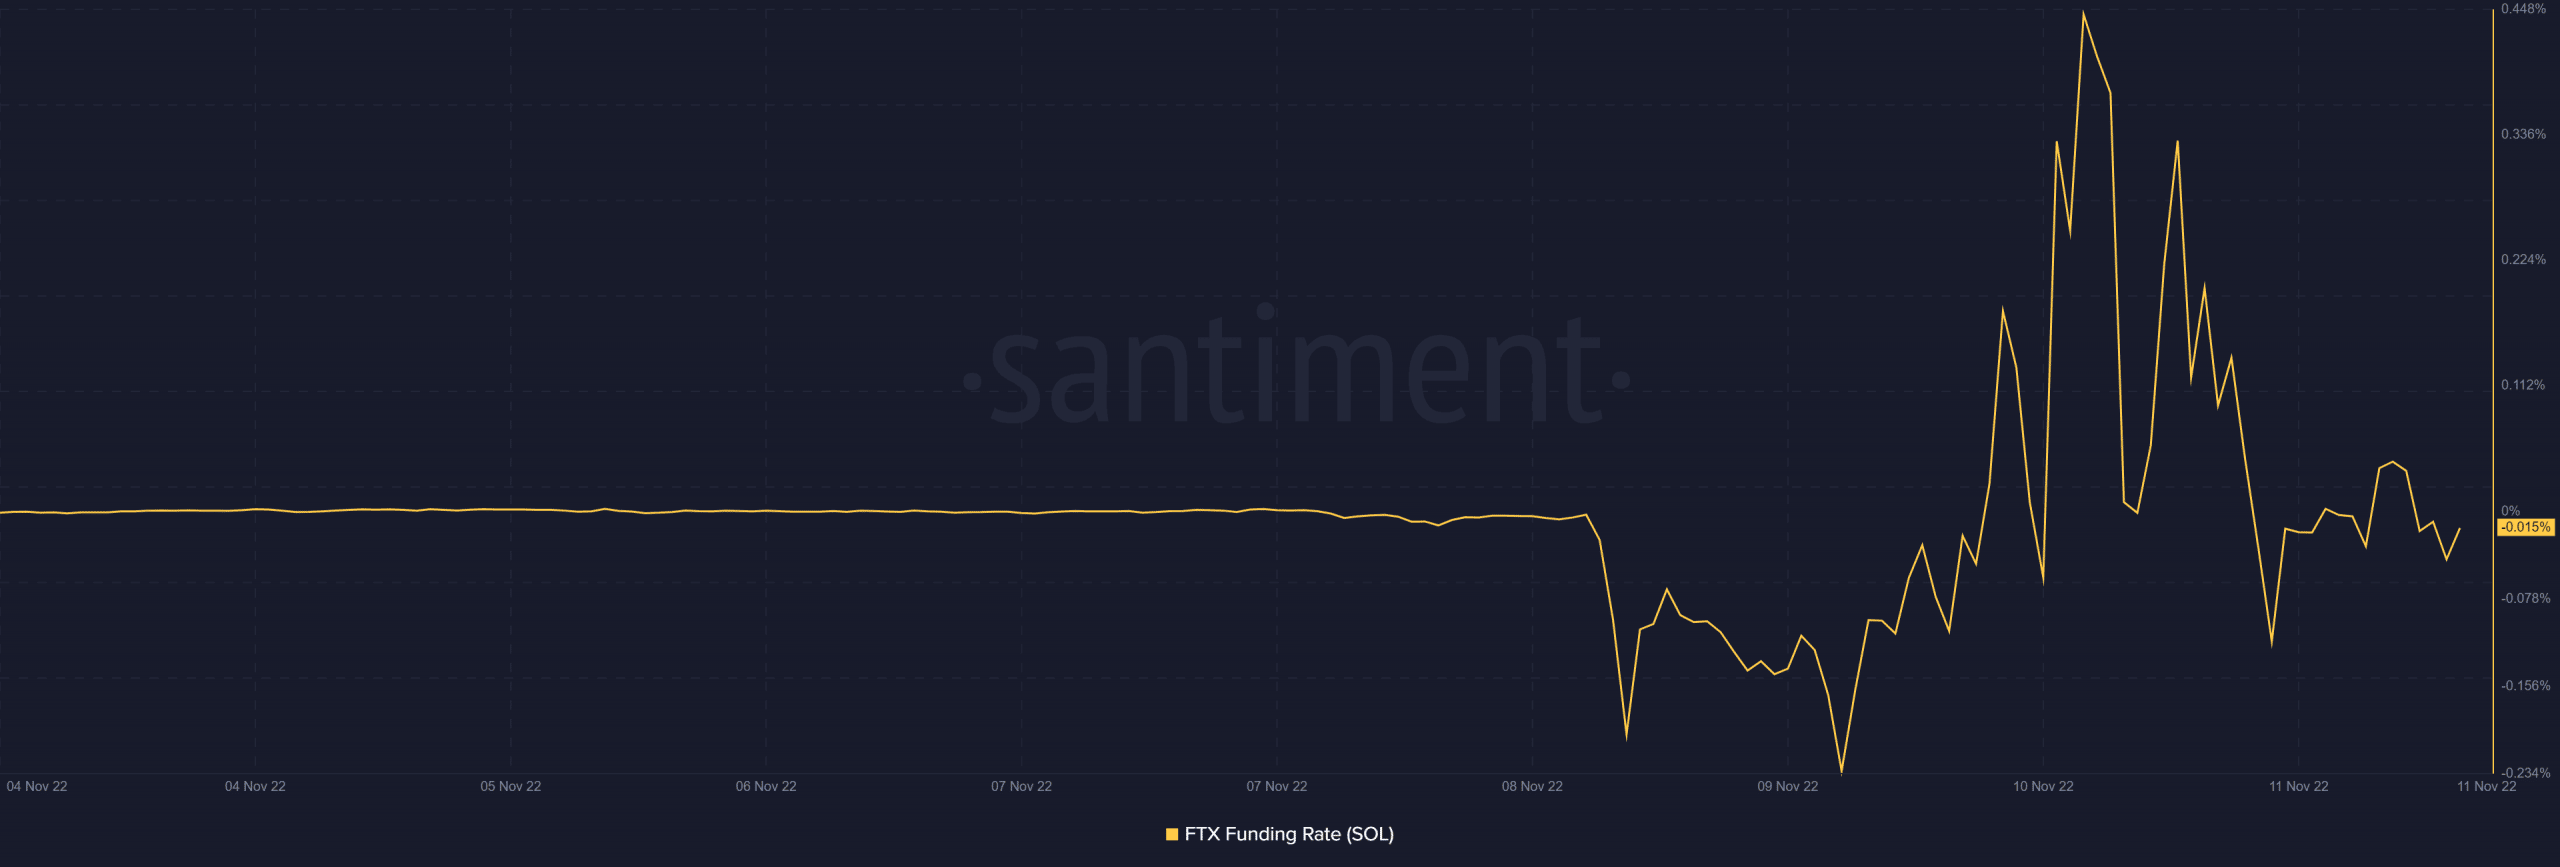
SOL also received quite some interest from the derivatives market as its FTX funding rate registered a spike last week, but went down later.
Looking forward
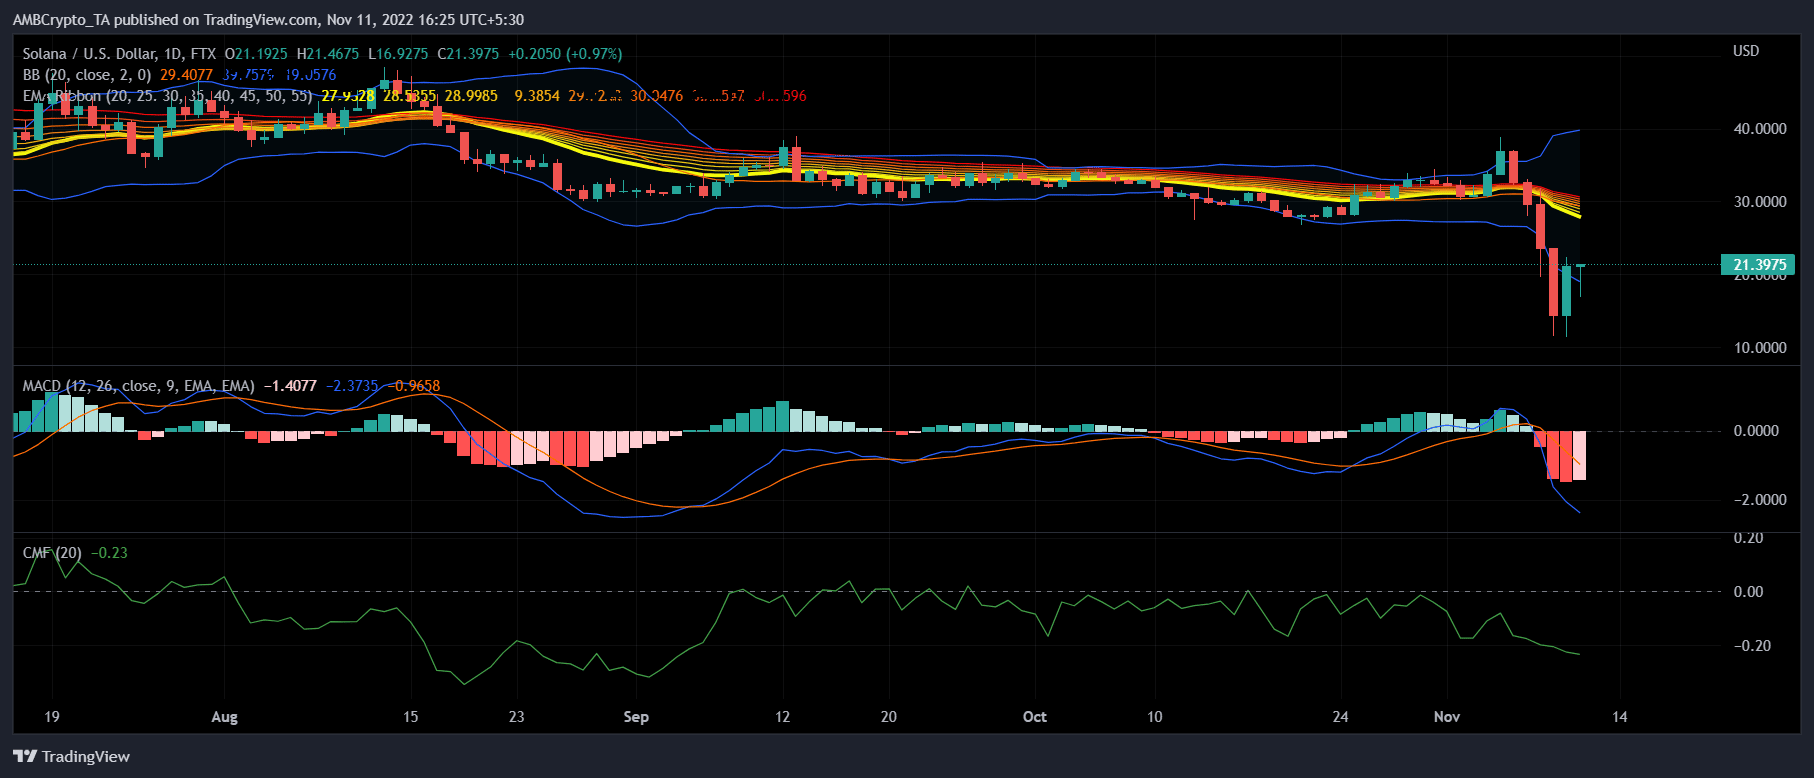
Unfortunately, the market indicators suggested that the hard days for investors were about to extend. Most indicators supported the possibility of a further price plummet. For example, the Exponential Moving Average (EMA) Ribbon indicated that the bears had an advantage in the market.
The MACD’s reading also supplemented the data of the EMA Ribbon, further increasing the chances of a price decline. Besides, SOL’s Chaikin Money Flow (CMF) was well below neutral, indicating a bearish trend.
The Bollinger Band indicated that SOL’s price was in a high volatility zone, which created a slight opportunity for SOL to register an uptick, as suggested by the metrics.

![Bittensor [TAO]](https://ambcrypto.com/wp-content/uploads/2026/07/Gladys-19-e1784100557377.jpg)