Solana [SOL] is back below $50 and here’s what investors need to do

Disclaimer: The findings of the following analysis are the sole opinions of the writer and should not be considered investment advice
Technical analysis of Solana showed that, on the longer timeframes, the price continued to trade within a bearish market structure despite its bounce from the $40 area.
Across the altcoin market, there was a bounce in the past few days. On lower timeframes such as the hourly, SOL even flipped to a bullish outlook the previous day. However, Bitcoin was trading within a range and its drop from $30.5k to $29k saw SOL suffer losses as well.
Solana- 1 Day Chart
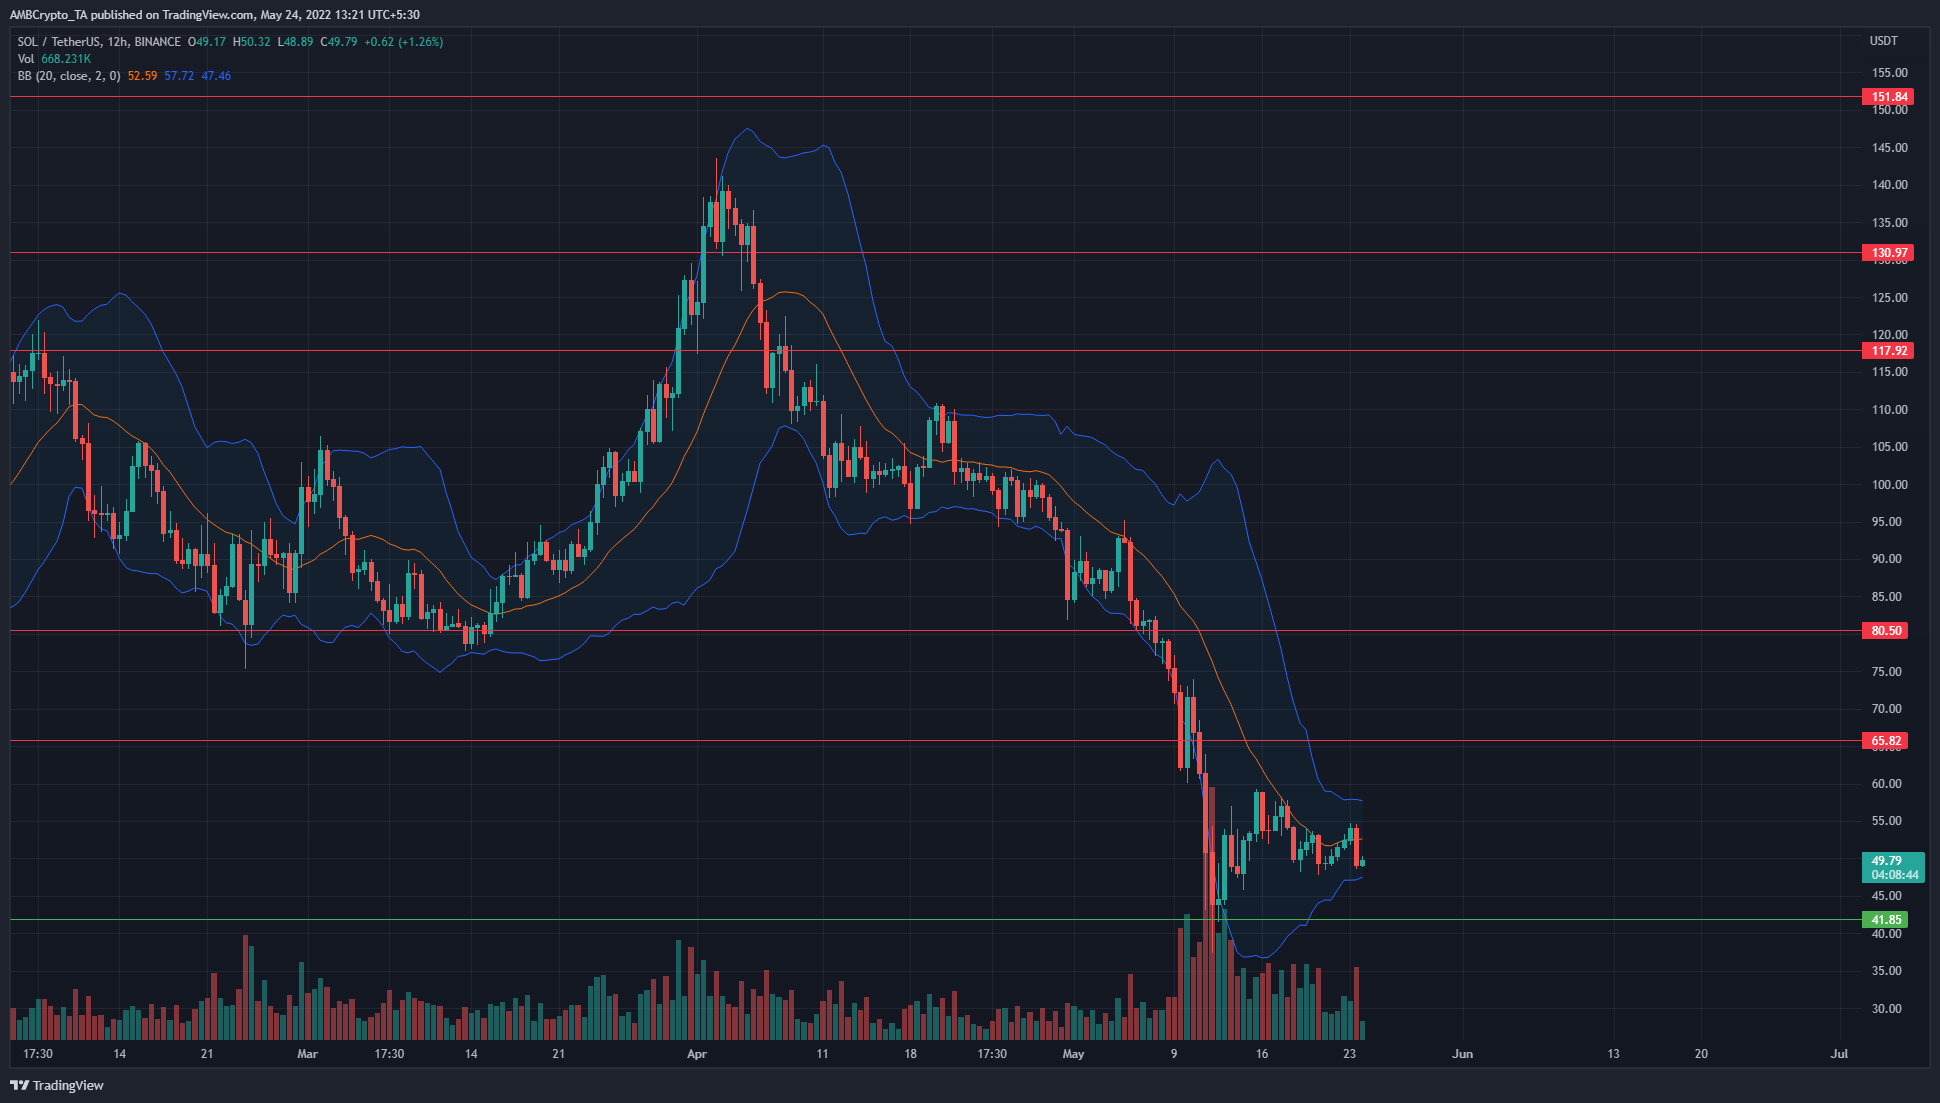
The Bollinger Bands had started to widen as April drew to a close and the price fell below the $95 mark and retested it as resistance. Since then, there has been a strong move downwards and SOL posted losses of nearly 60% from the bearish retest of $95, to drop to the $40 level.
At the time of writing, the Bollinger bands were tighter around the price, although this is not yet evidence of a sustained phase of accumulation for long-term investors to take advantage of. The price would need to break past the $60 level and retest it as support before we can entertain the idea of a push higher.
Above the $60-$65 area of resistance lies the $80 and the $95 resistance areas. In the coming weeks, two scenarios can play out. SOL could push toward the $75-$80 area to collect liquidity before another leg downward. Or, SOL could begin its descent from the $50 or the $60 levels as well, to fall toward $40 and $25.
Rationale
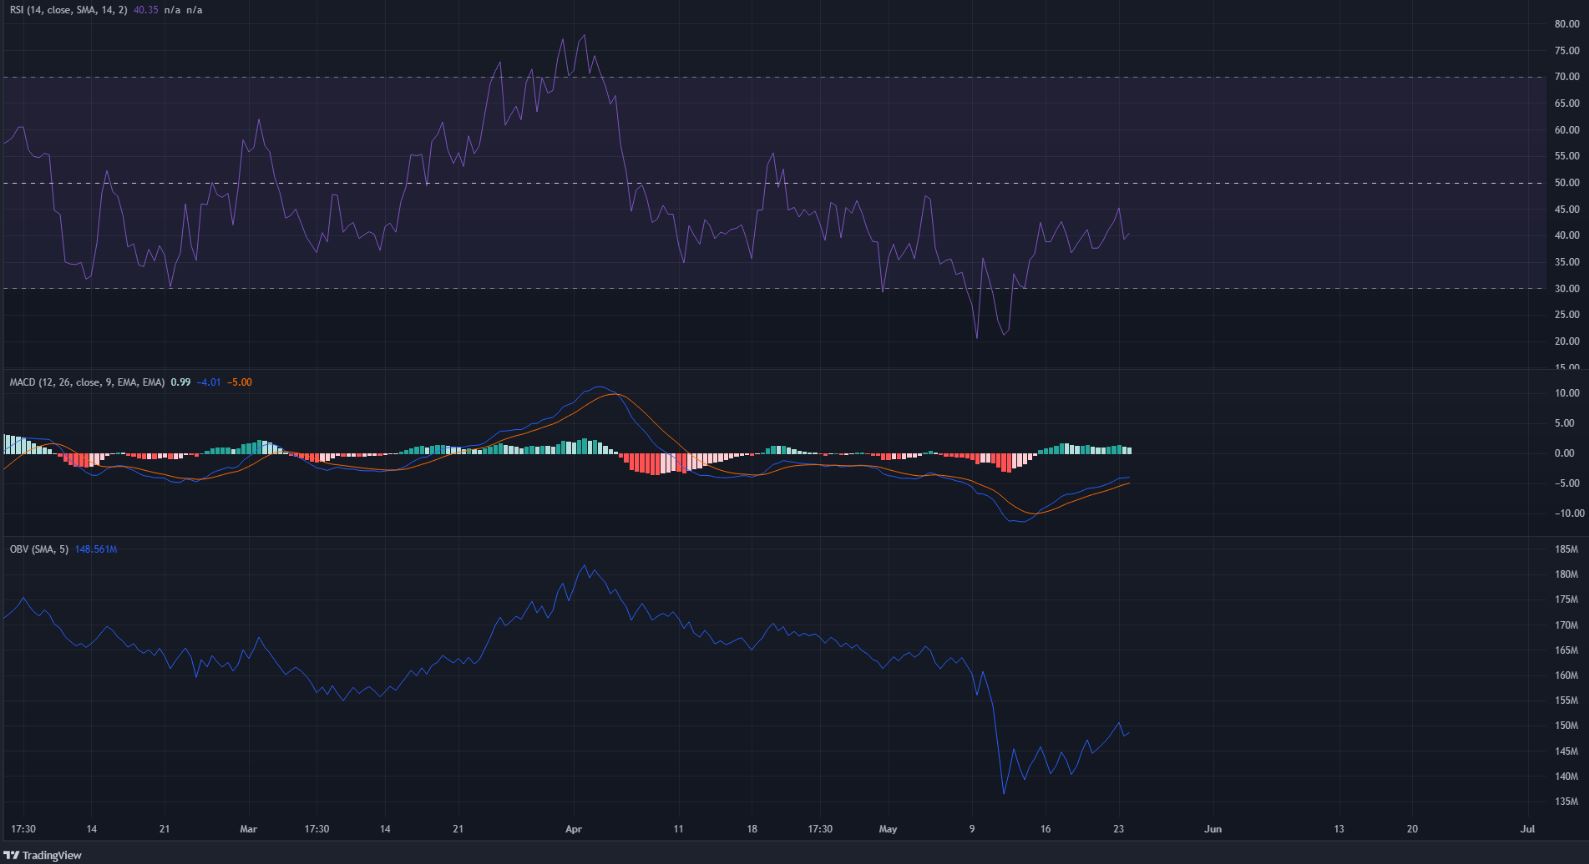
The RSI has been below the neutral 50 line since April, to denote a bearish trend in progress. This has not yet changed as the RSI stood at 40. Momentum remains bearish, and the MACD was also beneath the zero line to indicate the same. However, the MACD line (blue) formed a bullish crossover above the signal line (orange) to signal a pullback in progress, which could precede another leg downward.
The OBV has made higher lows in the past couple of weeks but has been unable to reclaim the selling volume earlier in May. Therefore, demand was not yet strong enough for a recovery on the charts for Solana.
Conclusion
Bitcoin, the king of crypto, will likely have a strong impact on the future trend of Solana and the token’s performance. A move to $60 or $75 would likely offer selling opportunities, while the $25-$30 area could be a bargain purchase in the months to come.


