Solana, THETA, MATIC Price Analysis: 01 July

At the time of writing, the cumulative cryptocurrency market’s 24-hour volume was $110 billion. At the same time, however, the total market cap was found to be $1.38 trillion, down 3.94% from yesterday.
While several cryptocurrencies including MATIC and Theta Network registered dips over the last 7 days, Solana showed signs of recovery with an 8.1% hike of its own.
Solana [SOL]

Source: SOL/USDT – Trading View
Solana was trading in the green at press time, with the alt recording a 5% price increase over the last 24 hours despite corrections over the last few hours. Its price has, however, rallied since the beginning of this week, hiking from $28.6 on 27 July to $35.8 earlier today.
SOL had a market cap of about $9.4 billion and was ranked 13th on CoinGecko, with the crypto valued at $34.05 at the time of writing.
Its Bollinger Bands were starting to converge on the charts – A sign of declining volatility and lower chances of sharp price movements. The Awesome Oscillator pictured a dominant bullish trend.
Capital inflows were higher than outflows for SOL, as per the Chaikin Money Flow, even though the latter were observed to be rising.
21Shares, the Switzerland-based investment product provider, recently announced the launch of the world’s first Solana exchange-traded product (ticker ASOL) on the Swiss stock exchange, SIX Exchange.
Theta Network [THETA]

Source: THETA/USDT – Trading View
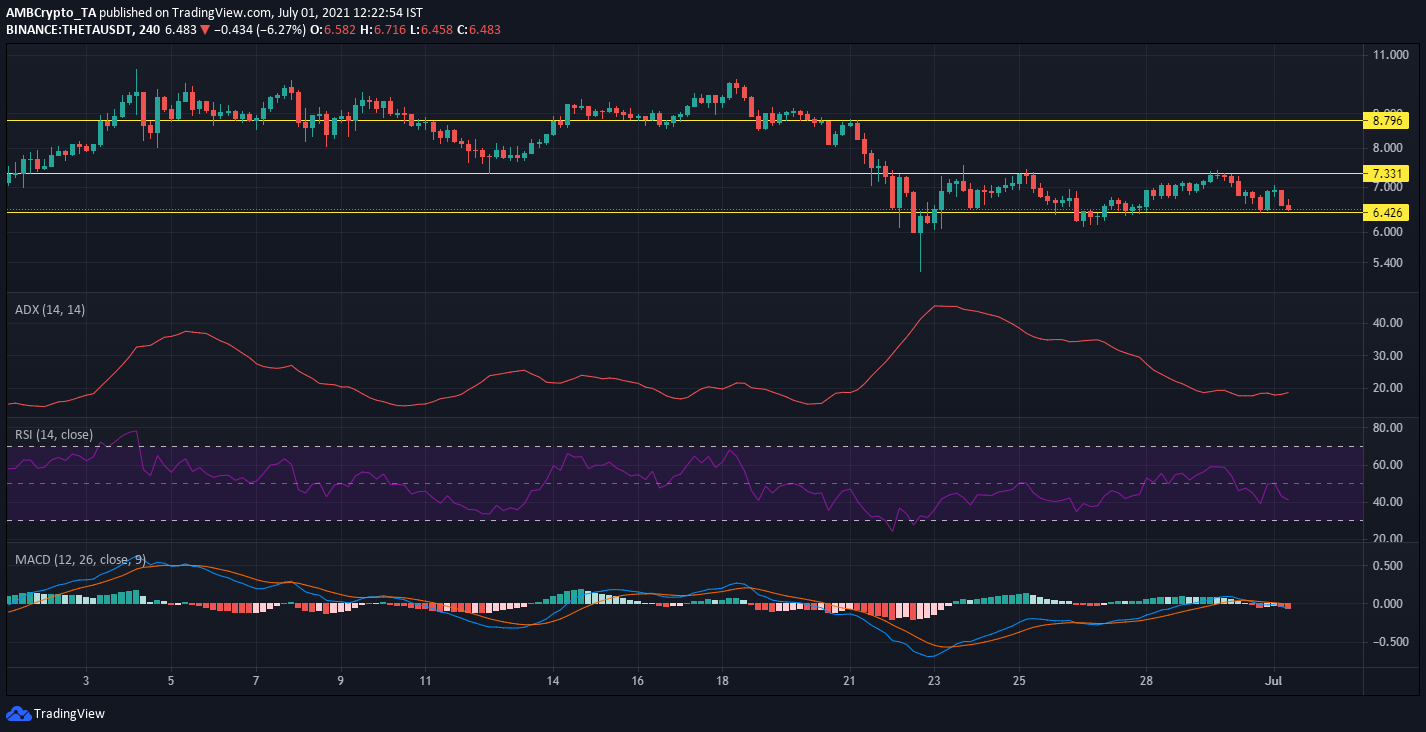
With a $6.6 billion market cap, THETA was ranked on CoinGecko’s rankings. Down 2.5% in the last 7 days, it was trading at $6.4 at the time of writing.
Recovering from the dip on 27 June, THETA’s price has lately been consolidating between the $6.4 support and $7.3 resistance levels. About a month ago, it had climbed as high as $10.4.
The 4-hour chart revealed a weak trend, as displayed by the Average Directional Index. The MACD and Signal lines underwent a bearish crossover whereas the Relative Strength Index highlighted increasing selling pressure.
Theta Mainnet 3.0 is expected to launch today, following the Theta blockchain hard fork.
Polygon [MATIC]

Source: MATIC/USDT – Trading View
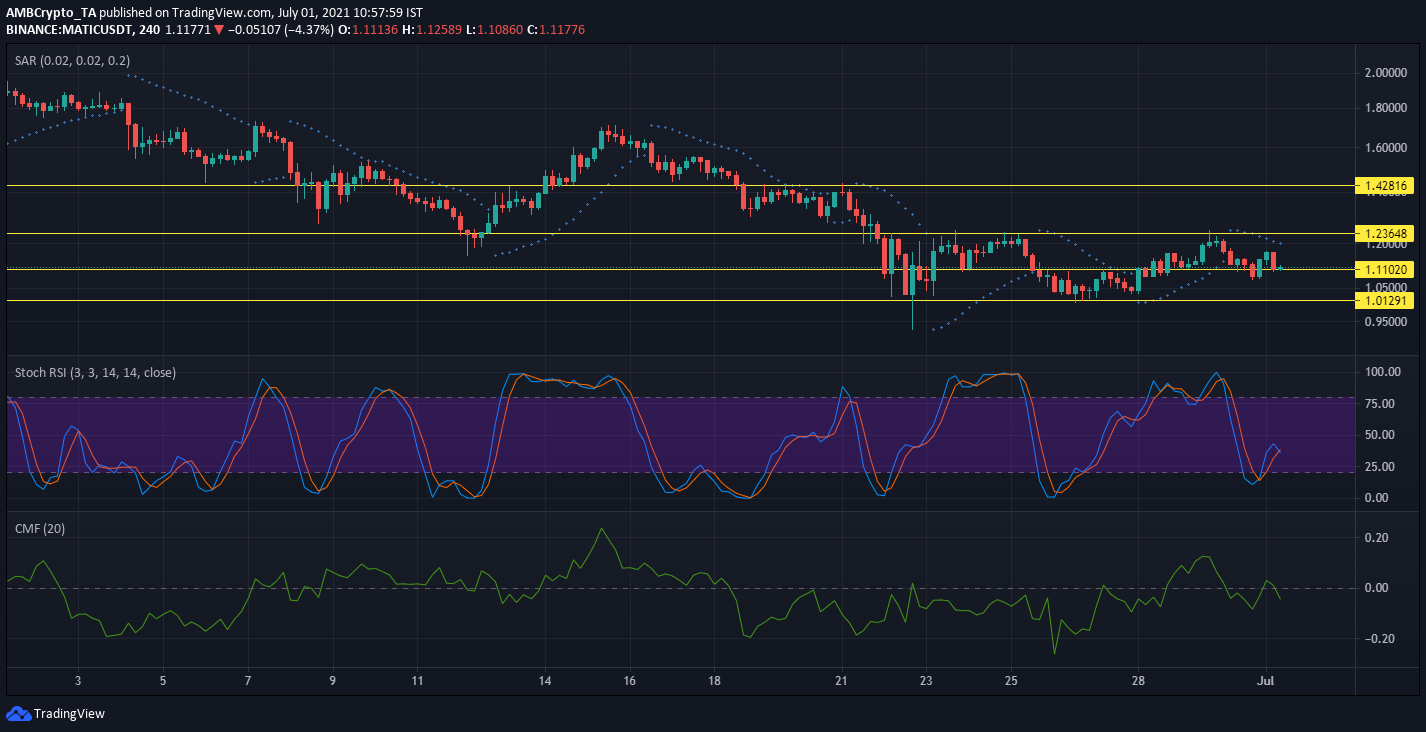
After almost touching $2 when June began, MATIC fell to $1.7 in mid-June and $1.15 by the end of last month. It was changing hands at $1.11, at the time of writing.
In fact, MATIC seemed to be on the verge of dipping below the $1.10 support. Earlier last month, MATIC took support at a lower price range of $1.01, and if the price continues to dip, it may revisit the same.
The Chaikin Money Flow indicator showed higher capital outflows.
The Stochastic RSI was below 50 and suggested that MATIC was trending lower, especially since a bearish crossover was incoming. The dotted line of the Parabolic SAR hovered above the candlesticks and pointed to a bearish trend on the charts.
Earlier today, the WePiggy lending protocol announced its upcoming launch on Polygon. It will also enable the liquidity mining program on Polygon.


![2024 saw OM [Mantra] outperform the rest, will 2025 be any different?](https://ambcrypto.com/wp-content/uploads/2024/12/MANTRA-400x240.webp)
