
- Solana fell below the important $172-level and found support near its 20-day EMA
- SOL’s derivates data revealed mixed market sentiment with a near-term bearish edge
A recent pattern break pulled SOL below the crucial 20-day EMA after the bears re-entered the market to provoke a downtrend over the last few days.
The previously overbought conditions provoked a well-anticipated reversal from the $186-resistance level, one that the bears have guarded for over three months now. At the time of writing, SOL was trading at $164 on the charts.
Will Solana bulls make a comeback soon?
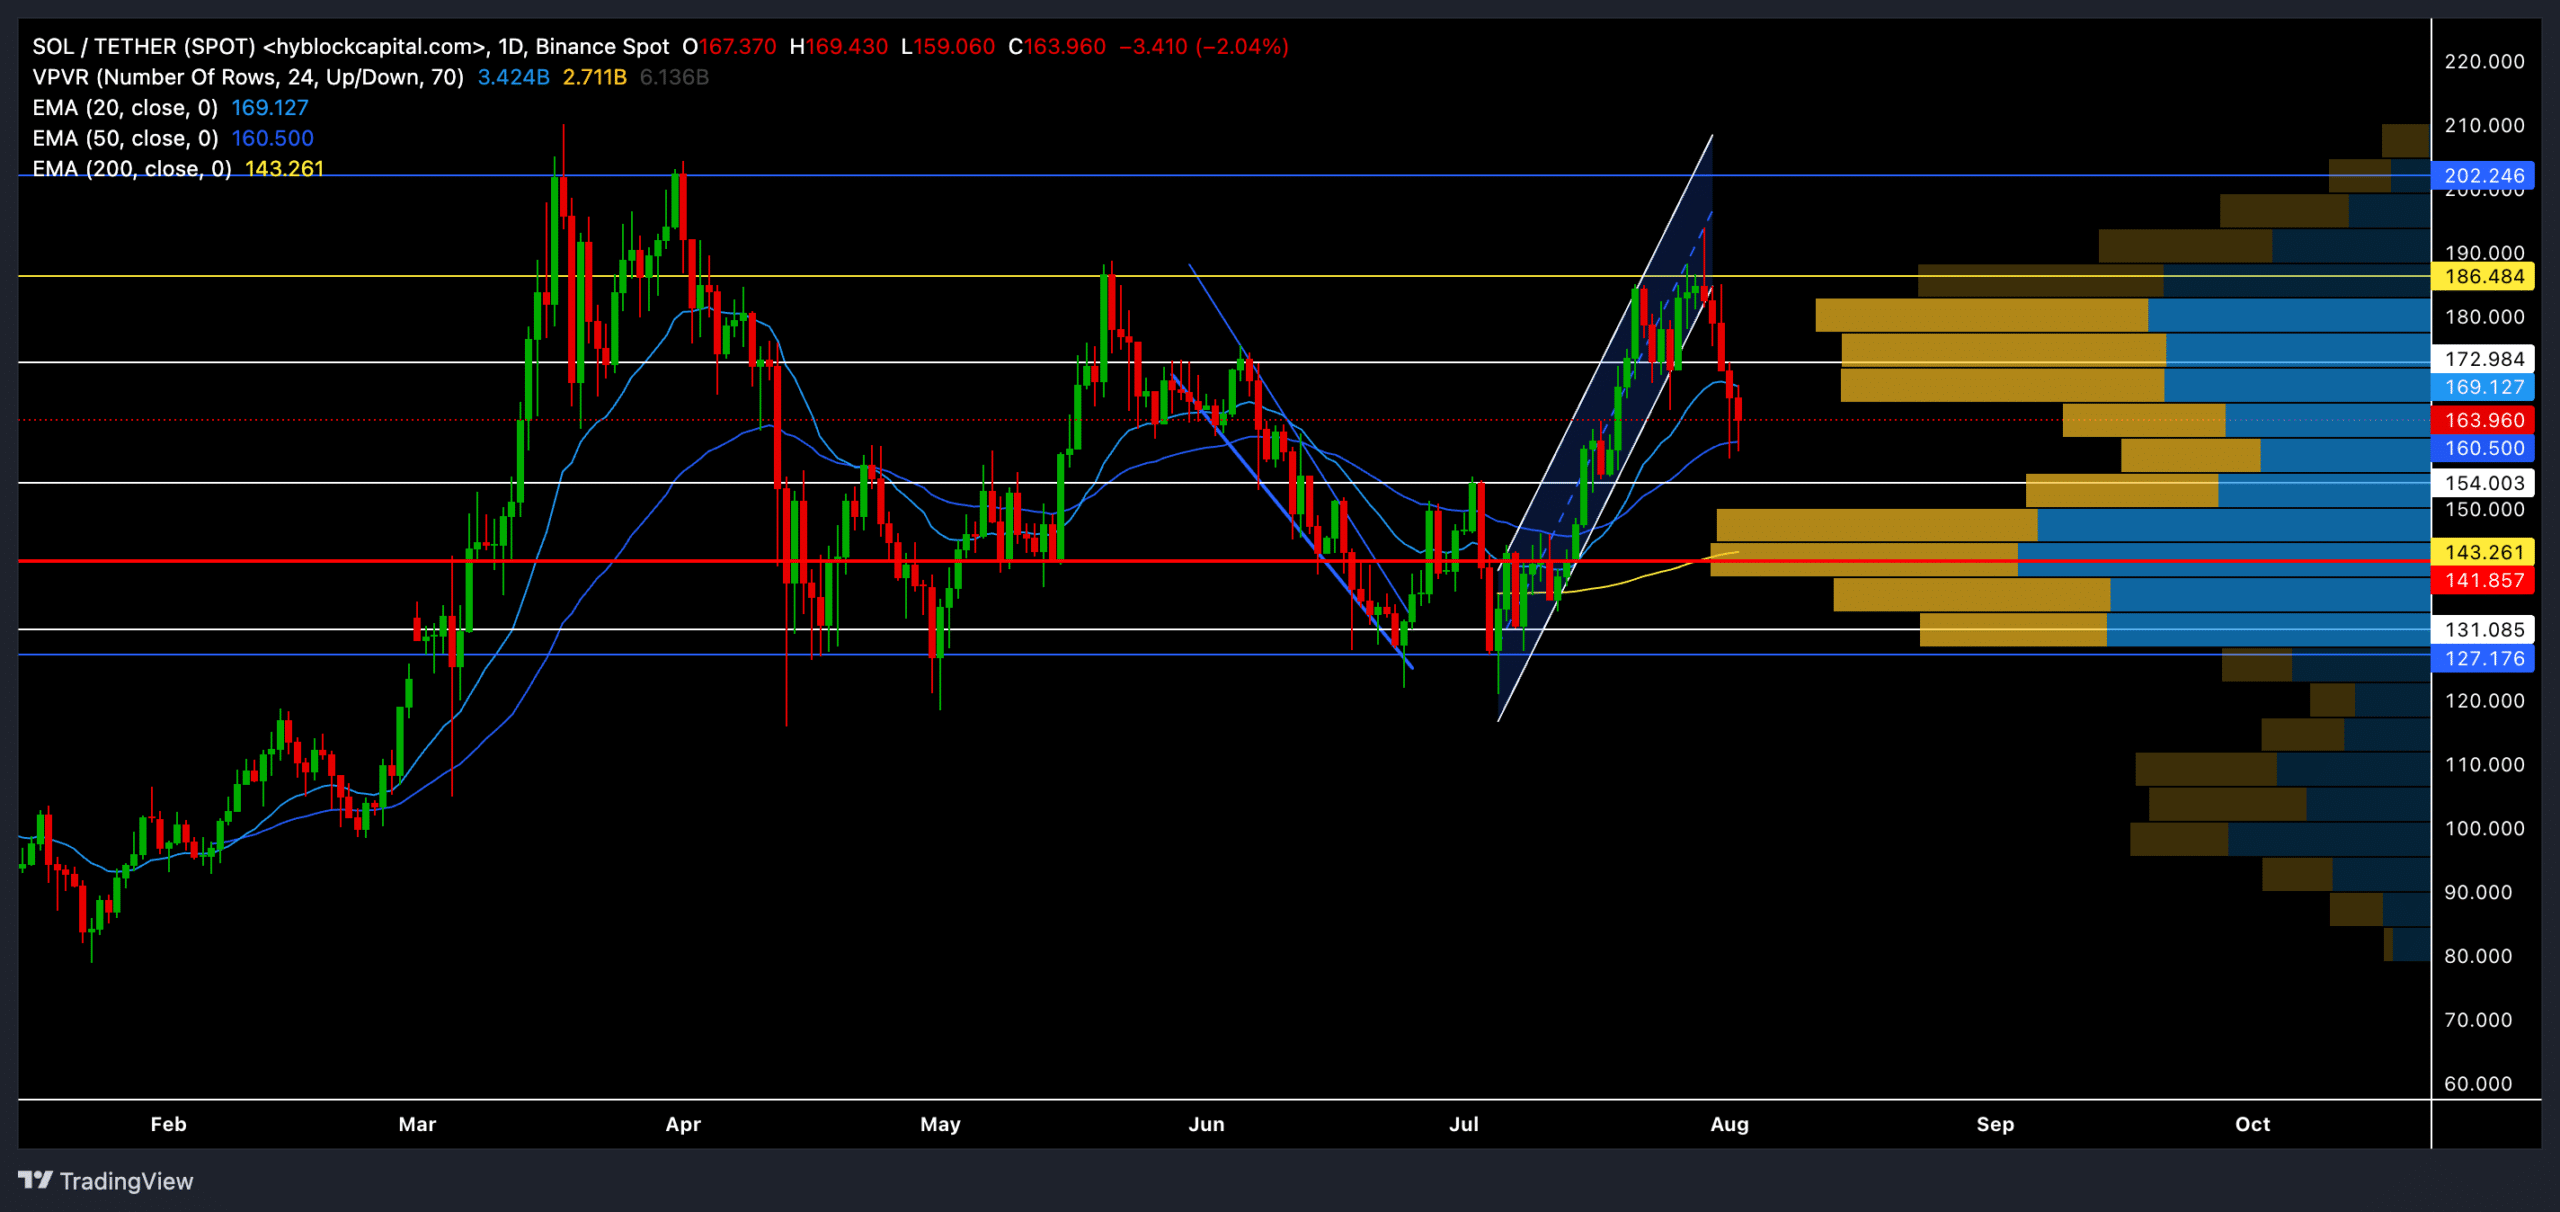
Source: TradingView, SOL/USDT
After rebounding from the $131 support level in early July, SOL bulls entered the market briefly and provoked a streak of green candles on the daily chart.
In the meantime, the altcoin formed a classic ascending channel pattern and registered an ROI of nearly 45% in just over three weeks.
However, the bears stepped in at the $186-resistance level and provoked an anticipated downtrend on the charts. As a result, SOL’s price saw a patterned breakout and fell below the 20-day EMA.
This downtrend had pulled SOL into a relatively low liquidity zone, at the time of writing. As a result, traders can expect high volatility in the next few days.
The altcoin will likely look to retest the $154 support level before a possible bullish reversal. In this case, SOL will look to retest the $172-$173 range.
Should the bears continue to exert pressure, any decline below the $154-support can delay any immediate recovery prospects. In such a case, bears will look to retest the $142-$145 range in the coming days.
The RSI dipped below 50 to show a slight bearish edge at press time. A sustained trajectory below this level will reaffirm an ease in selling pressure.
Moreover, the MACD lines saw a bearish cross and confirmed an ease in buying pressure. Buyers should look for a close below zero, before going short on the popular altcoin.
Derivates data revealed THIS

Source: Coinglass
Derivatives data highlighted bearish sentiment in the Solana market, with more traders taking short positions and a notable reduction in Open Interest.
The high volume may be seen as a sign of active trading, but the liquidation data indicated that many long traders were liquidated due to the price drop. Even so, it’s worth noting that the long/short ratios on major exchanges favor long positions.
Finally, buyers should consider Bitcoin’s movements and factor in the broader market sentiment before making any buying decisions.