Solana TVL hits $2B after a year – A sign of recovery or not?
Though Solana's TVL saw an increase, the price of SOL has declined by over 7%.

- Solana TVL has hit a new milestone.
- SOL has declined by over 7% in the past three days.
Solana’s [SOL] Total Value Locked (TVL) has been making efforts to regain its pre-FTX highs. Recently, it reached a TVL milestone for the first time in over a year. The question now is whether it has been able to maintain this newfound level.
Solana hits pre-FTX level
The analysis of Solana’s Total Value Locked (TVL) on DefiLlama showed a gradual ascent starting from around October 2023, with significant progress observed in December 2023.
Before the October increase, the TVL was around $350 million, reaching around $1.4 billion by December.
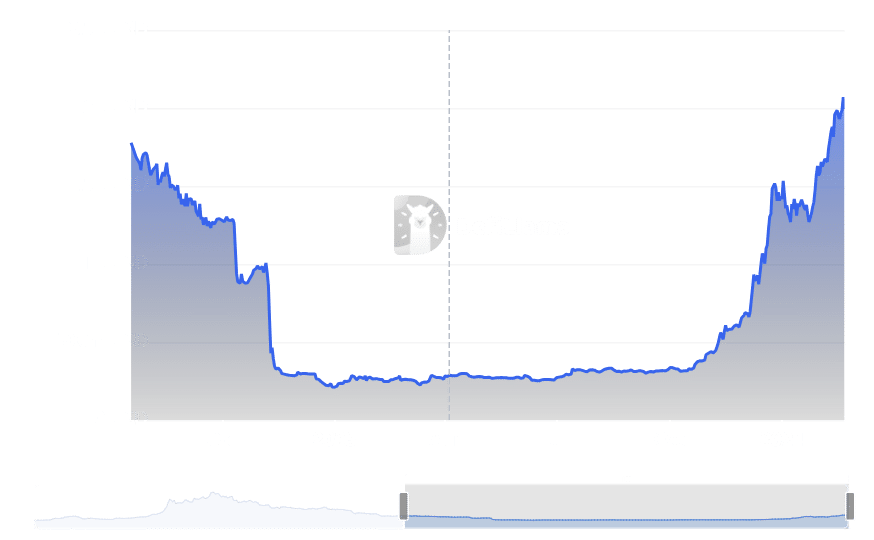
Notably, by the end of 20th December, the TVL had increased to $2.069 billion. This marked a significant milestone as it was the first time since June 2022 that the TVL reached the $2 billion level.
Moreover, it signaled a recovery for Solana from the setback associated with the FTX collapse, marking the first instance since then that Solana attained this TVL.
At the time of this writing, the Total Value Locked (TVL) has declined to around $1.9 billion, indicating a failure to sustain the momentum observed in the preceding day.
Solana volume stays in steady zone
An examination of Solana’s volume on DefiLlama showed that the recent uptick it experienced has remained strong. The volume trend indicated a notable increase on 20th February, following a slight dip from 17th February. At the time of this writing, the volume was over $765 million.
This elevated volume serves as an indicator of the heightened activity witnessed on the Solana network. It is reflective of the increased engagement observed on various chains within the network.
Further analysis of the Total Value Locked (TVL) of these chains showed a substantial increase over the past month.
SOL descends into bear trend
The Solana daily timeframe chart showed a decline since its peak above $117 on 14th February.
Is your portfolio green? Check out the SOL Profit Calculator
Over the last three days, there has been a decrease of about 7%. At the time of this writing, it was trading at around $103.8, reflecting a further decline of over 4%.
The persistent decrease has weakened its bull trend, and the Relative Strength Index (RSI) has fallen below the neutral zone. This indicates that SOL has transitioned into a bear trend, albeit a relatively weak one at this time.