Solana, VeChain, EOS Price Analysis: 02 February

As the bulls endeavored to counter the long-term bearish tendencies in the market, Solana saw overbought readings on its 4-hour RSI and Bollinger Bands. This would likely propel a near-term setback. Further, EOS continued its up-channel trajectory but struggled to gather enough volumes. In the case of VeChain, any close below near-term SMA would confirm the selling edge.
Solana (SOL)

Since breaking down from the $167-mark on 5 January, SOL bears were in the driving seat while initiating substantial sell-offs. It saw a 52.2% loss (from 5 January) and touched its five-month low on 24 January.
Over the last two weeks, the alt witnessed a bearish flag on its 4-hour chart. The past 24 hours marked notable gains after SOL bounced back from the lower trendline of the up-channel (white). It saw an over 20% jump but now seemingly slowed down as it approached the upper band of the Bollinger Bands. Further retracements from here would again find testing grounds at the lower trendline.
At press time, SOL was trading at $109.57. The RSI exponentially grew after breaching the 43-mark. Now, it saw a pullback from the overbought territory as it eyed to test the 56-level support.
VeChain (VET)
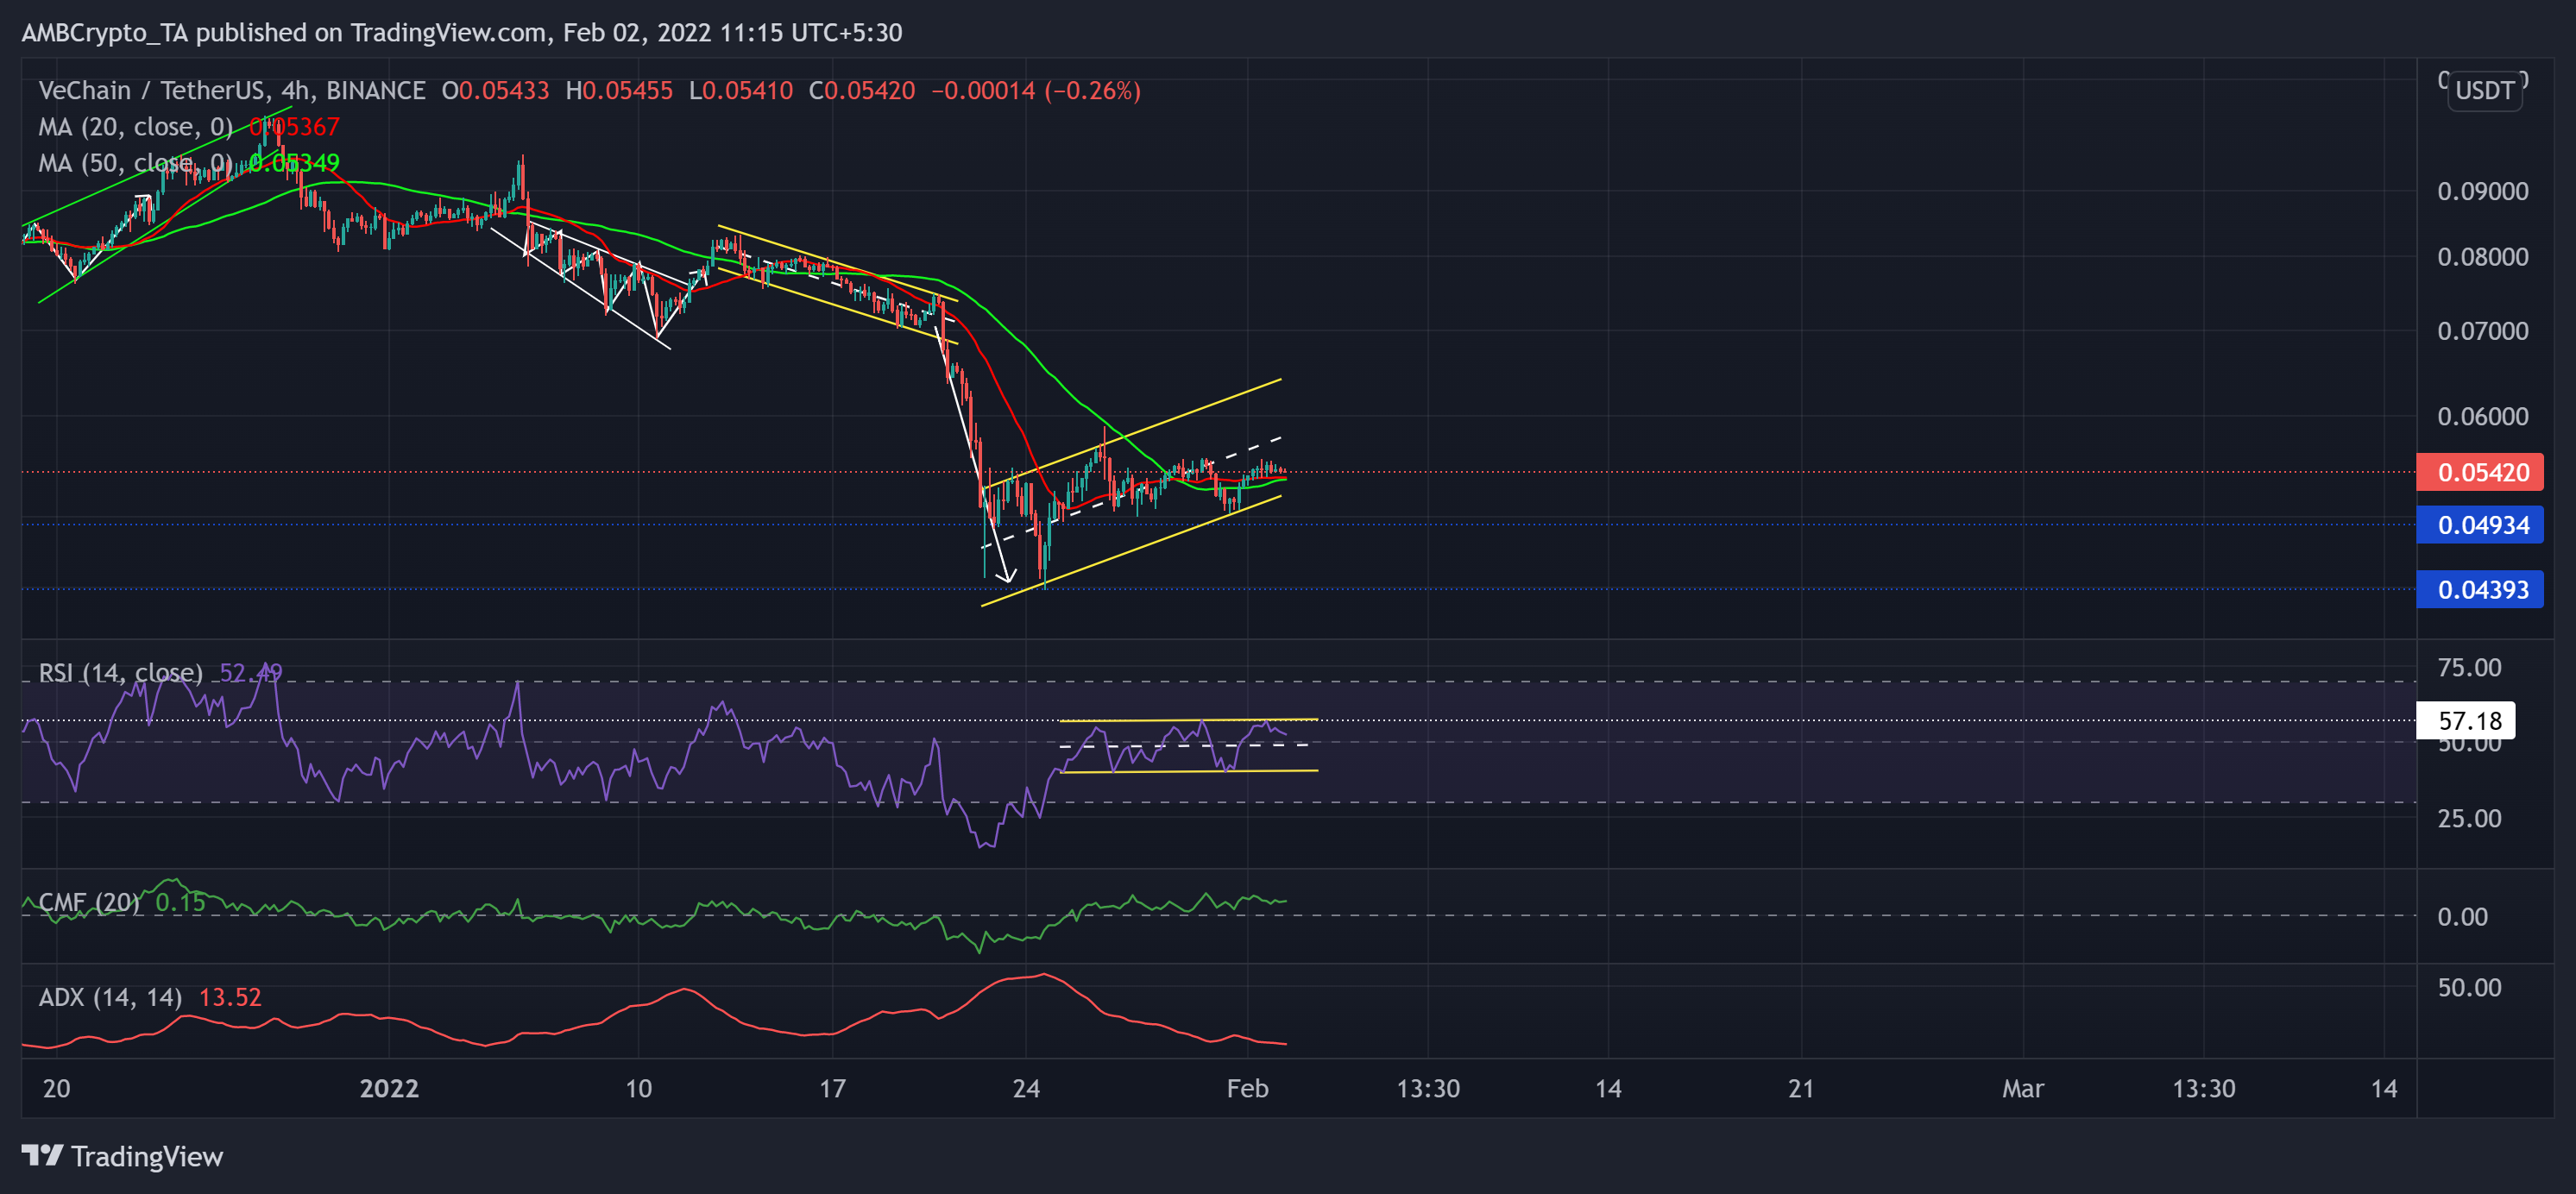
As the bearish influence prevailed, the sellers stepped in to breach the $0.05856-mark resistance (previous support). VET lost 54.15% of its value (from 5 January) and fell toward its 11-month low on 24 January.
Over the past few days, VET formed a bearish flag on its 4-hour chart. Now, the bulls found a hard time climbing the equilibrium (white, dashed line) of the up-channel (yellow). As a result, the 20 SMA (red) and 50 SMA (green) were again on the verge of a bearish crossover. Any close below these levels would cause a retest around the $0.051-level.
At press time, VET traded at $0.0542. The RSI moved in a side-channel after continually facing a barrier at the 57-mark. Although it skewed in favor of buyers, it approached the half-line. Also, the CMF exhibited a bullish edge after a sharp uptrend over the last day. However, the ADX stood extremely weak, hinting at a weak directional trend.
EOS
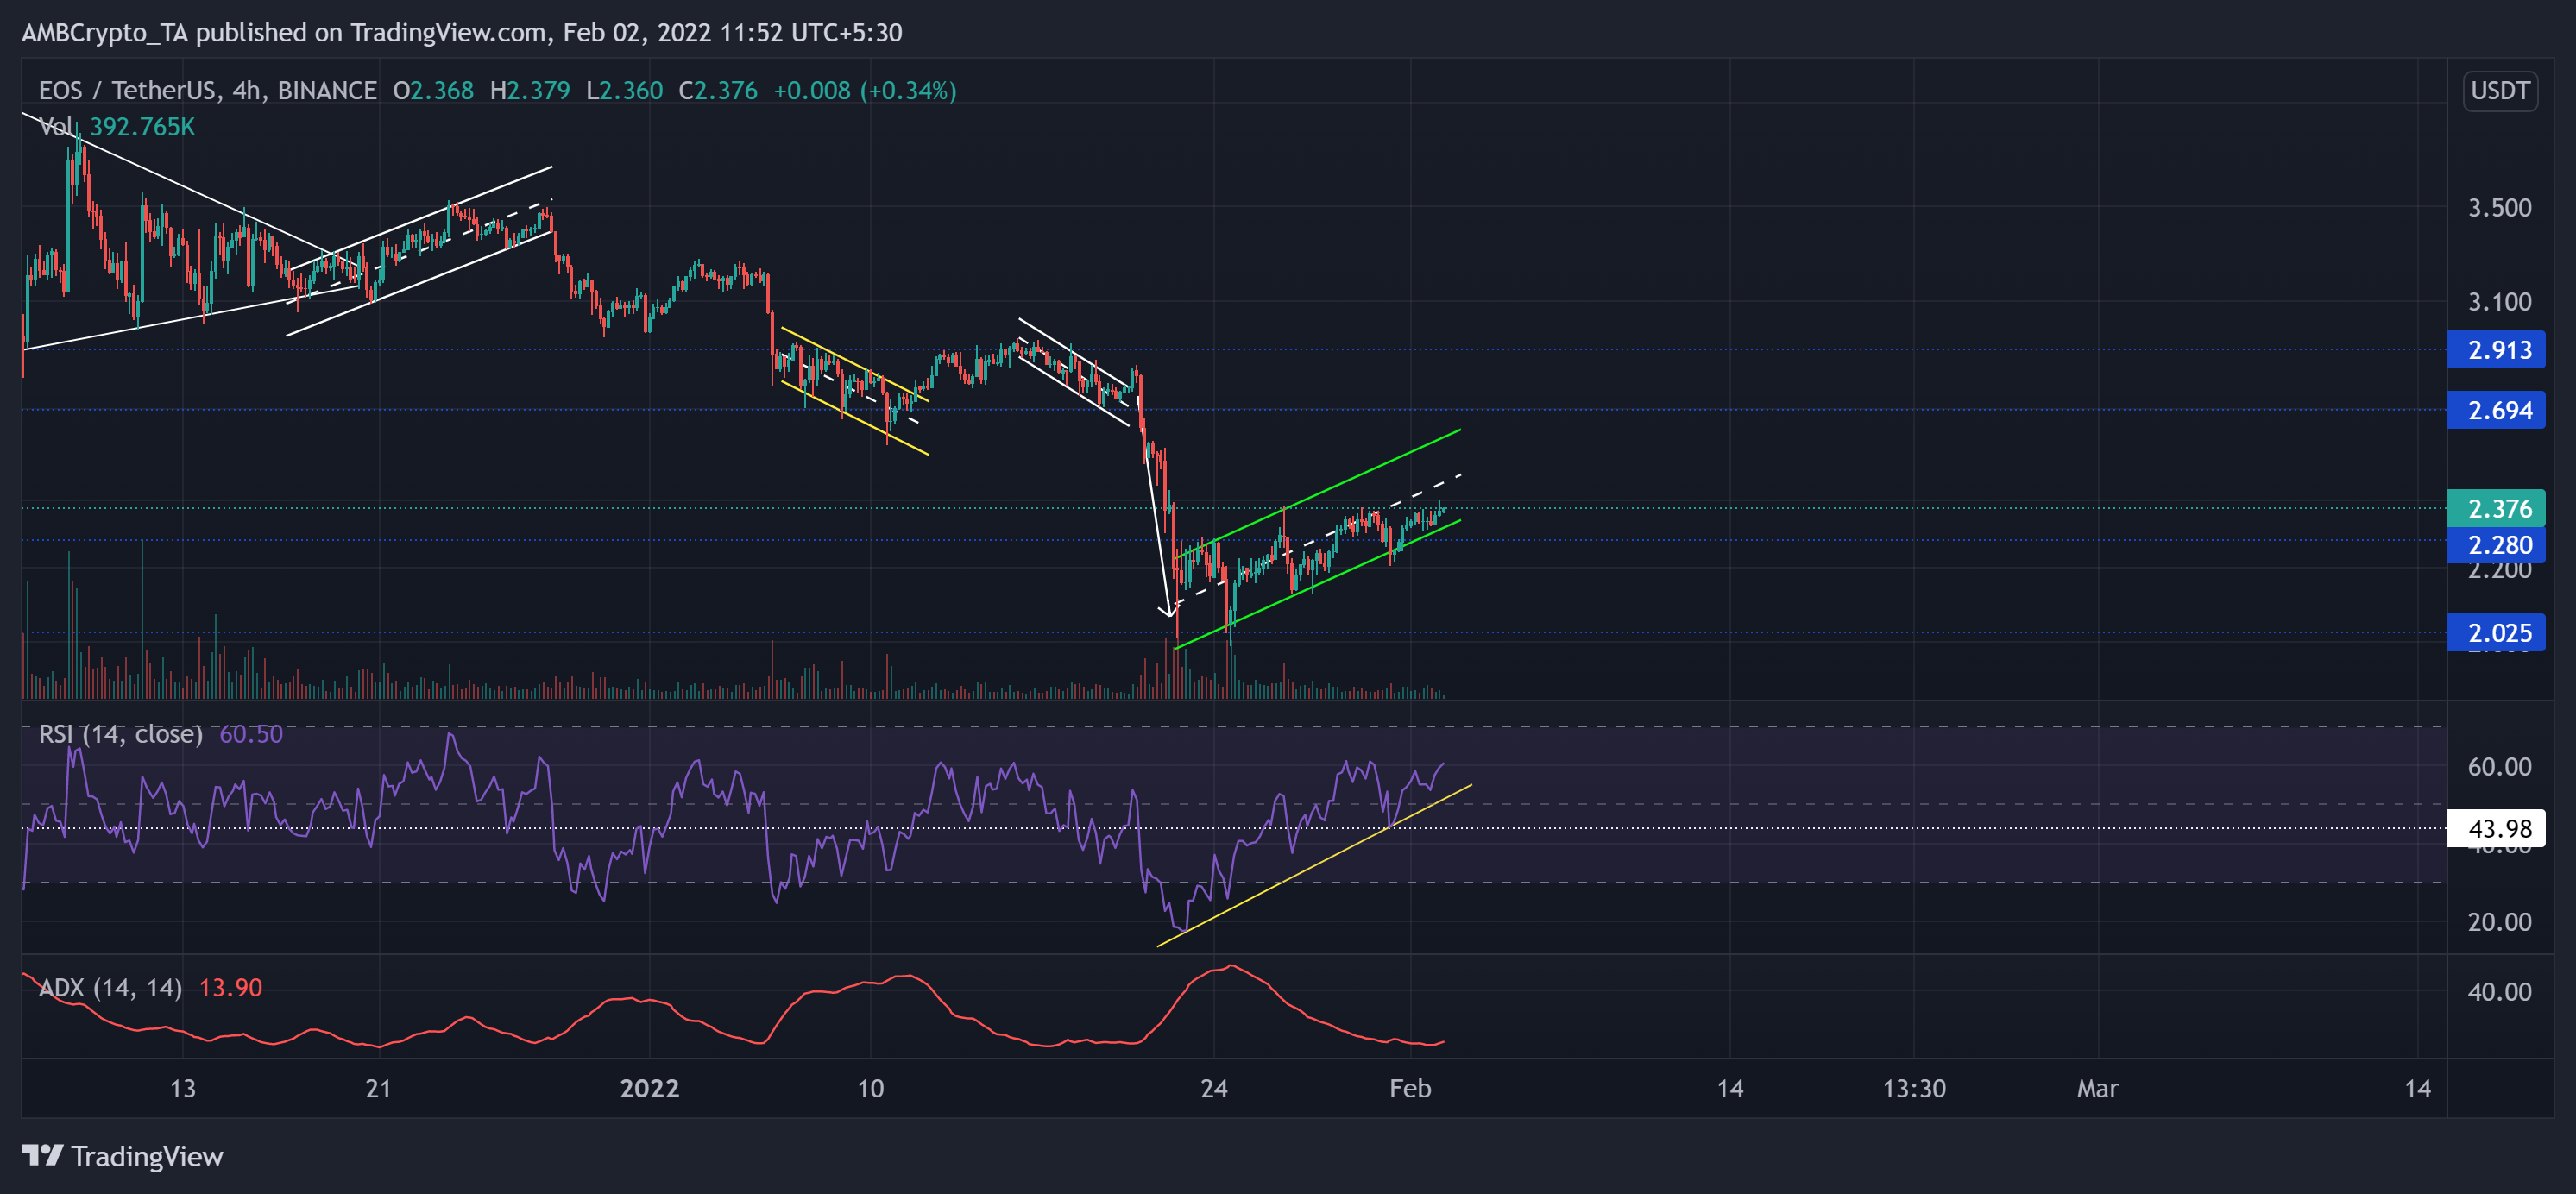
The altcoin has been on a long-term downtrend (since early September). Due to this, the recent down-channel (white) breakout quickly reversed due to the broader sell-off on 21 January. As a result, EOS marked a 30.41% decline and touched its 22-month low on 24 January.
The alt saw a bearish flag on the 4-hour chart. The half-line of the up-channel (green) assumed resistance for the last six days. Meanwhile, the bears kept testing the lower trendline of the channel.
At press time, the alt traded at $2.376. The RSI saw impressive gains and found a sustainable close above the half-line. But like VET, EOS’ ADX affirmed a weak directional trend.