Solana vs Polygon: How is 2023 turning out to be for both?

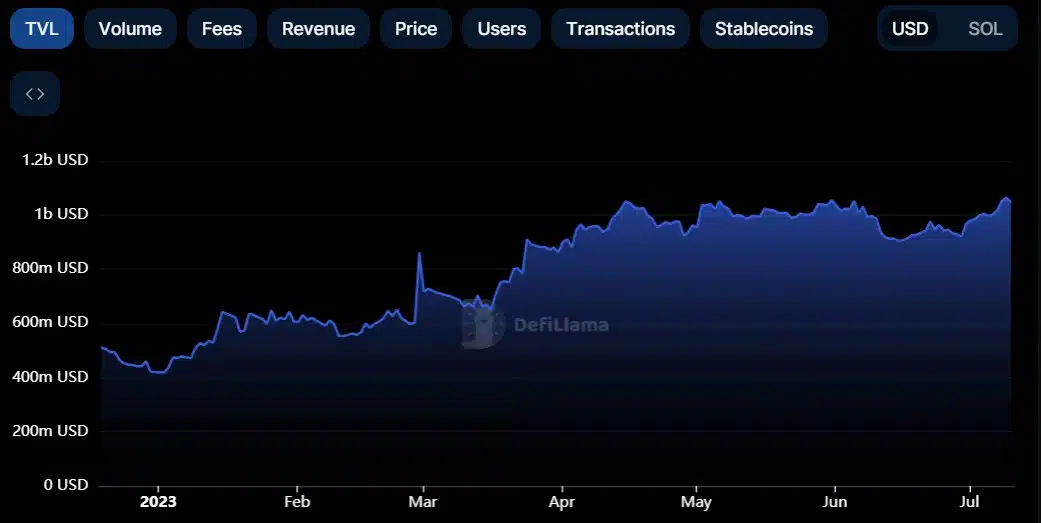
- Solana’s TVL gained and hit its highest level since the beginning of 2023
- MATIC’s market cap plummeted in June, while SOL registered gains
Over the last few months, Polygon [MATIC] has witnessed a surge in its network activity, with the same higher than that of Solana [SOL]. However, Solana still dominated Polygon by a significant margin in terms of transactions. Not only that, but SOL’s performance in the DeFi space also remains promising, as its TVL hit this year’s highest level recently. In fact, SOL also outshined MATIC by its price action, as the former overtook the latter in market capitalization.
Read Polygon’s [MATIC] Price Prediction 2023-24
Is Polygon actually ahead of Solana?
Artemis’ data pointed out that Solana’s daily active addresses declined over the last three months. This allowed Polygon to overtake Solana in terms of that metric. Moreover, MATIC has consistently managed to have more users on the network to date. However, looking at the whole picture revealed that MATIC is still way behind SOL in the number of daily transactions processed by the networks.
Not only that, Solana is also closing in on Polygon in terms of their captured value. As is evident from Artemis’ chart, Solana’s fees and revenue have gained since mid-July, even flipping Polygon on two occasions.
However, at press time, Polygon’s fees and revenue remained slightly higher than those of SOL. Nonetheless, SOL recently touched a new milestone. DeFiLlama pointed out that SOL’s TVL was moving up and, at press time, was sitting at the highest level since the beginning of the year.
A wider look at both blockchains
Apart from network activity, both blockchains’ staking ecosystems are also interesting to observe. SOL is way ahead of MATIC in terms of staking market cap, as the former’s figures stood at $9.77 billion, while the latter had a staking market cap of $2.4 billion at press time. While MATIC had a staking ratio of 38.91%, SOL posted a reading of 70.84%. Moreover, the number of staking wallets was also higher on Solana than on Polygon.
Nonetheless, Santiment’s chart revealed both blockchains have been performing neck to neck in their respective NFT ecosystems. Both MATIC and SOL had similar numbers of NFT trade counts and trade volume in USD, which proves the competition.
Bullish price action for Solana?
Towards the beginning of May, MATIC’s market cap was well above that of SOL. However, things started to turn sour for MATIC as it bled considerably over the next few weeks. This allowed Solana to take over, as the token flipped MATIC on 6 July. Since then, the latter has been able to reclaim its lead in terms of market cap.
Is your portfolio green? Check the Solana Profit Calculator
In fact, as per CoinMarketCap, SOL’s price appreciated by over 7% over the past week. On the contrary, MATIC only managed to hike by 1%. At press time, SOL was trading at $24.77 while MATIC’s value was $0.6794 on the charts.


