- Solana’s TVL sits at its highest level in 22 months.
- Key technical indicator hints at the rise in bearish activity in the SOL market.
Solana’s [SOL] decentralized finance (DeFi) total value locked (TVL) has reached its highest level since May 2022, according to DefiLlama’s data.
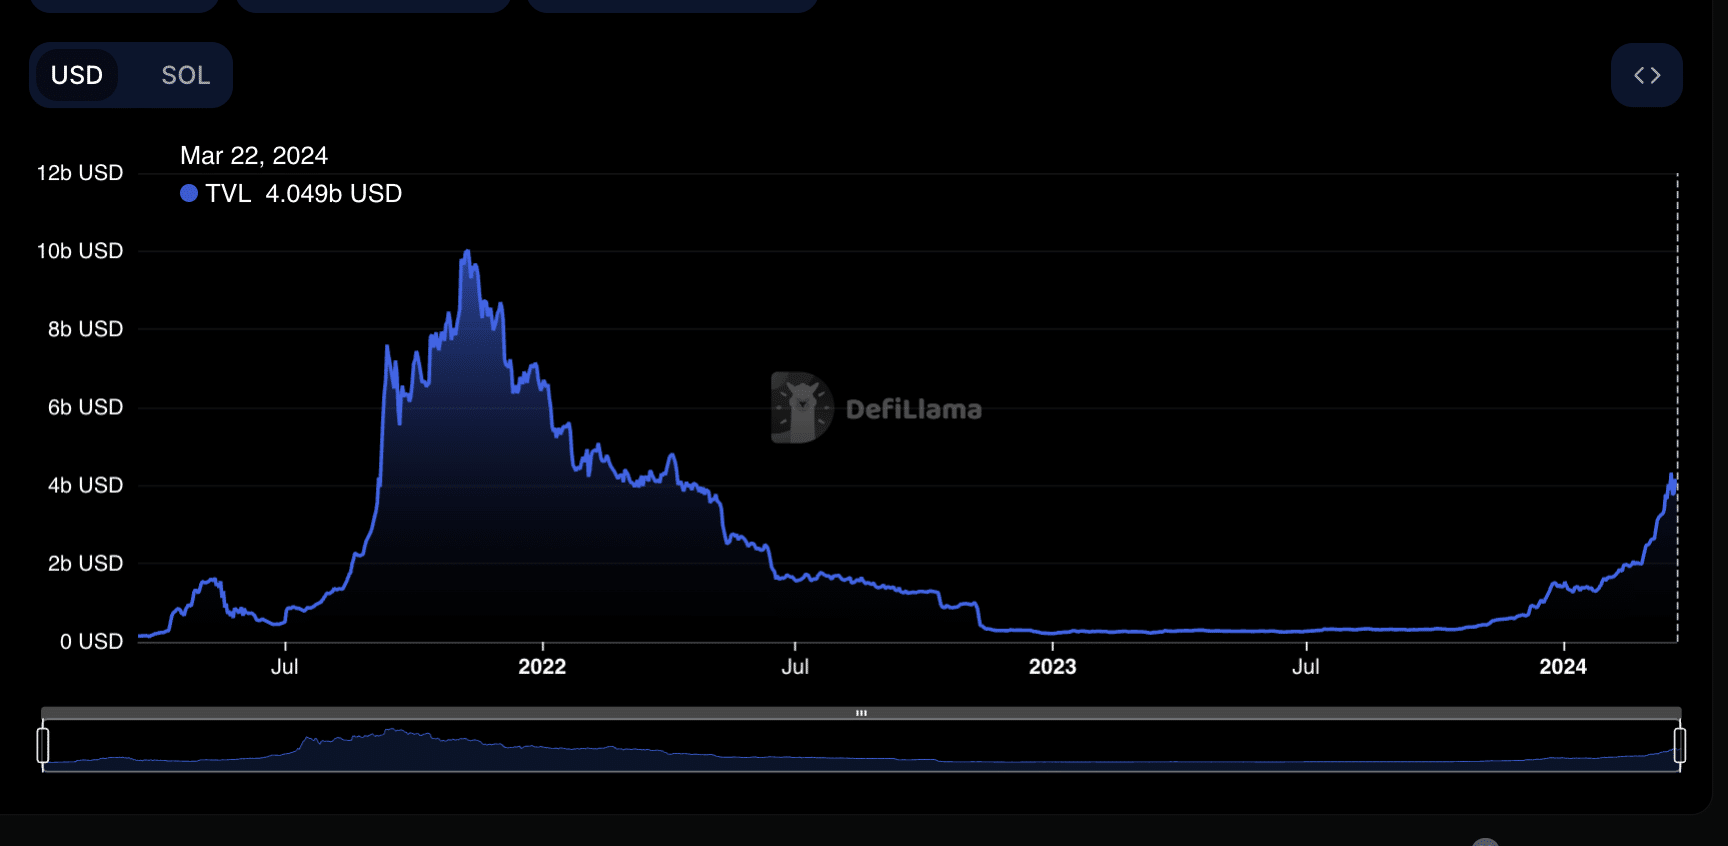
Source: DefiLlama
At press time, the Layer 1 (L1) network’s TVL was $4.03 billion, having risen by 97% in 30 days. According to DefiLlama’s ranking, Solana is the only blockchain amongst the top 10 DeFi networks that its TVL has risen by this much in the last 30 days.
Rise in user demand for Solana
The surge in Solana’s TVL is attributed to a recent uptick in user activity on the network.
According to The Block’s data dashboard, the monthly count of new addresses on Solana has risen to an all-time high. In the past 21 days, the number of unique first signers to transact in the Solana Network has totaled 16.32 million.
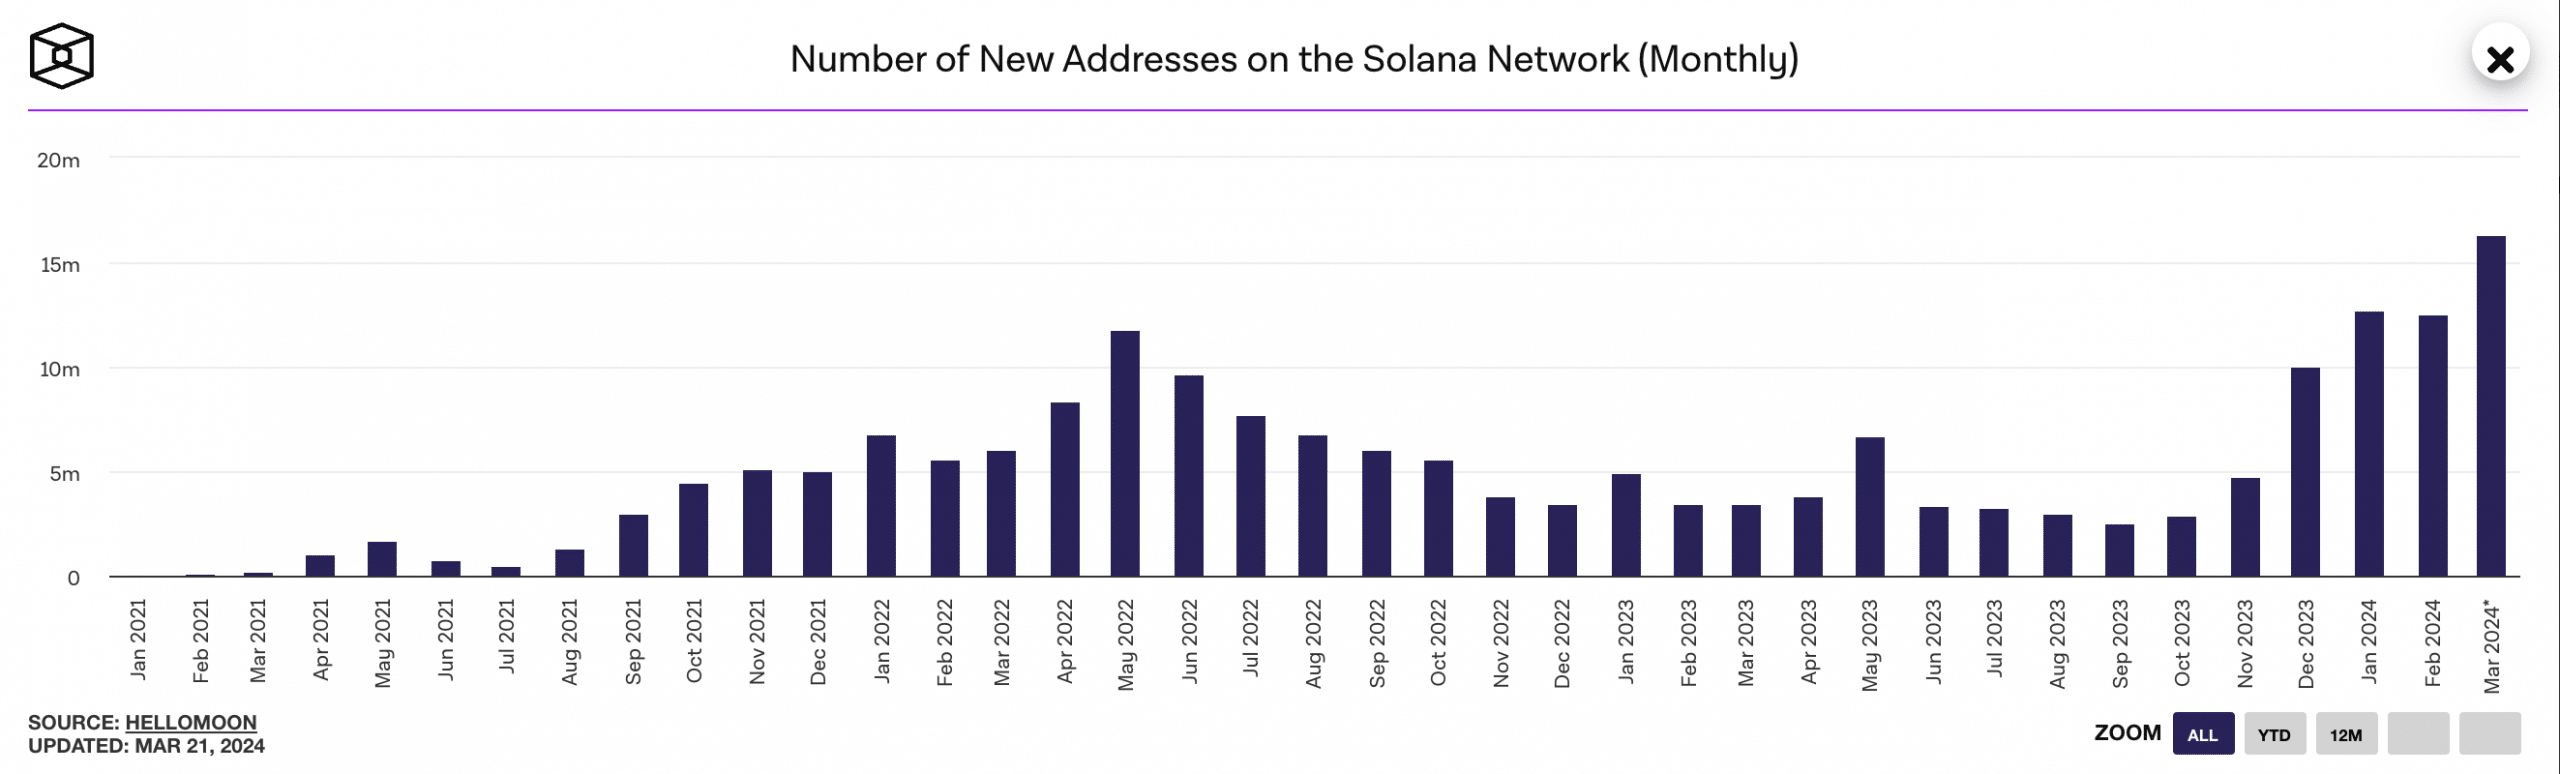
Source: The Block
Further, the month so far has been marked by a significant uptick in active address count. AMBCrypto found that this has amounted to 22.19 million, representing Solana’s highest since July 2022.
Due to the rise in user activity on the chain, the total amount of transaction fees paid on Solana climbed to a multi-month high of $5.08 million on 18th March.
DefiLlama’s data showed that on that day, protocol revenue derived from transaction fees rose to an all-time high of $2.5 million.
SOL demand trickles in but bearish sentiments rise
SOL exchanged hands at $179 at press time, according to CoinMarketCap’s data. Although impacted by the general market decline in the past week, the demand for SOL continues to outpace coin sell-offs among spot market participants.
AMBCrypto’s readings of the coin’s key momentum indicators showed that they were positioned above their neutral lines at press time.
For example, SOL’s Relative Strength Index (RSI) and Money Flow Index (MFI) were 61.19 and 80.74, respectively. These values showed that daily traders favored SOL accumulation over distribution.
Further, the coin’s positive Chaikin Money Flow (CMF) value indicated an inflow of liquidity into the SOL market. As of this writing, SOL’s CMF was 0.16.
How much are 1,10,100 SOLs worth today?
However, despite this, SOL’s Parabolic SAR (Stop and Reverse) indicator hinted at the steady rise in bearish activity, mirroring the decline in bullish sentiment in the general market.
This indicator identifies potential trend direction and reversals. When its dotted lines rest above an asset’s price, traders take it as a signal to exit long positions or initiate short positions.
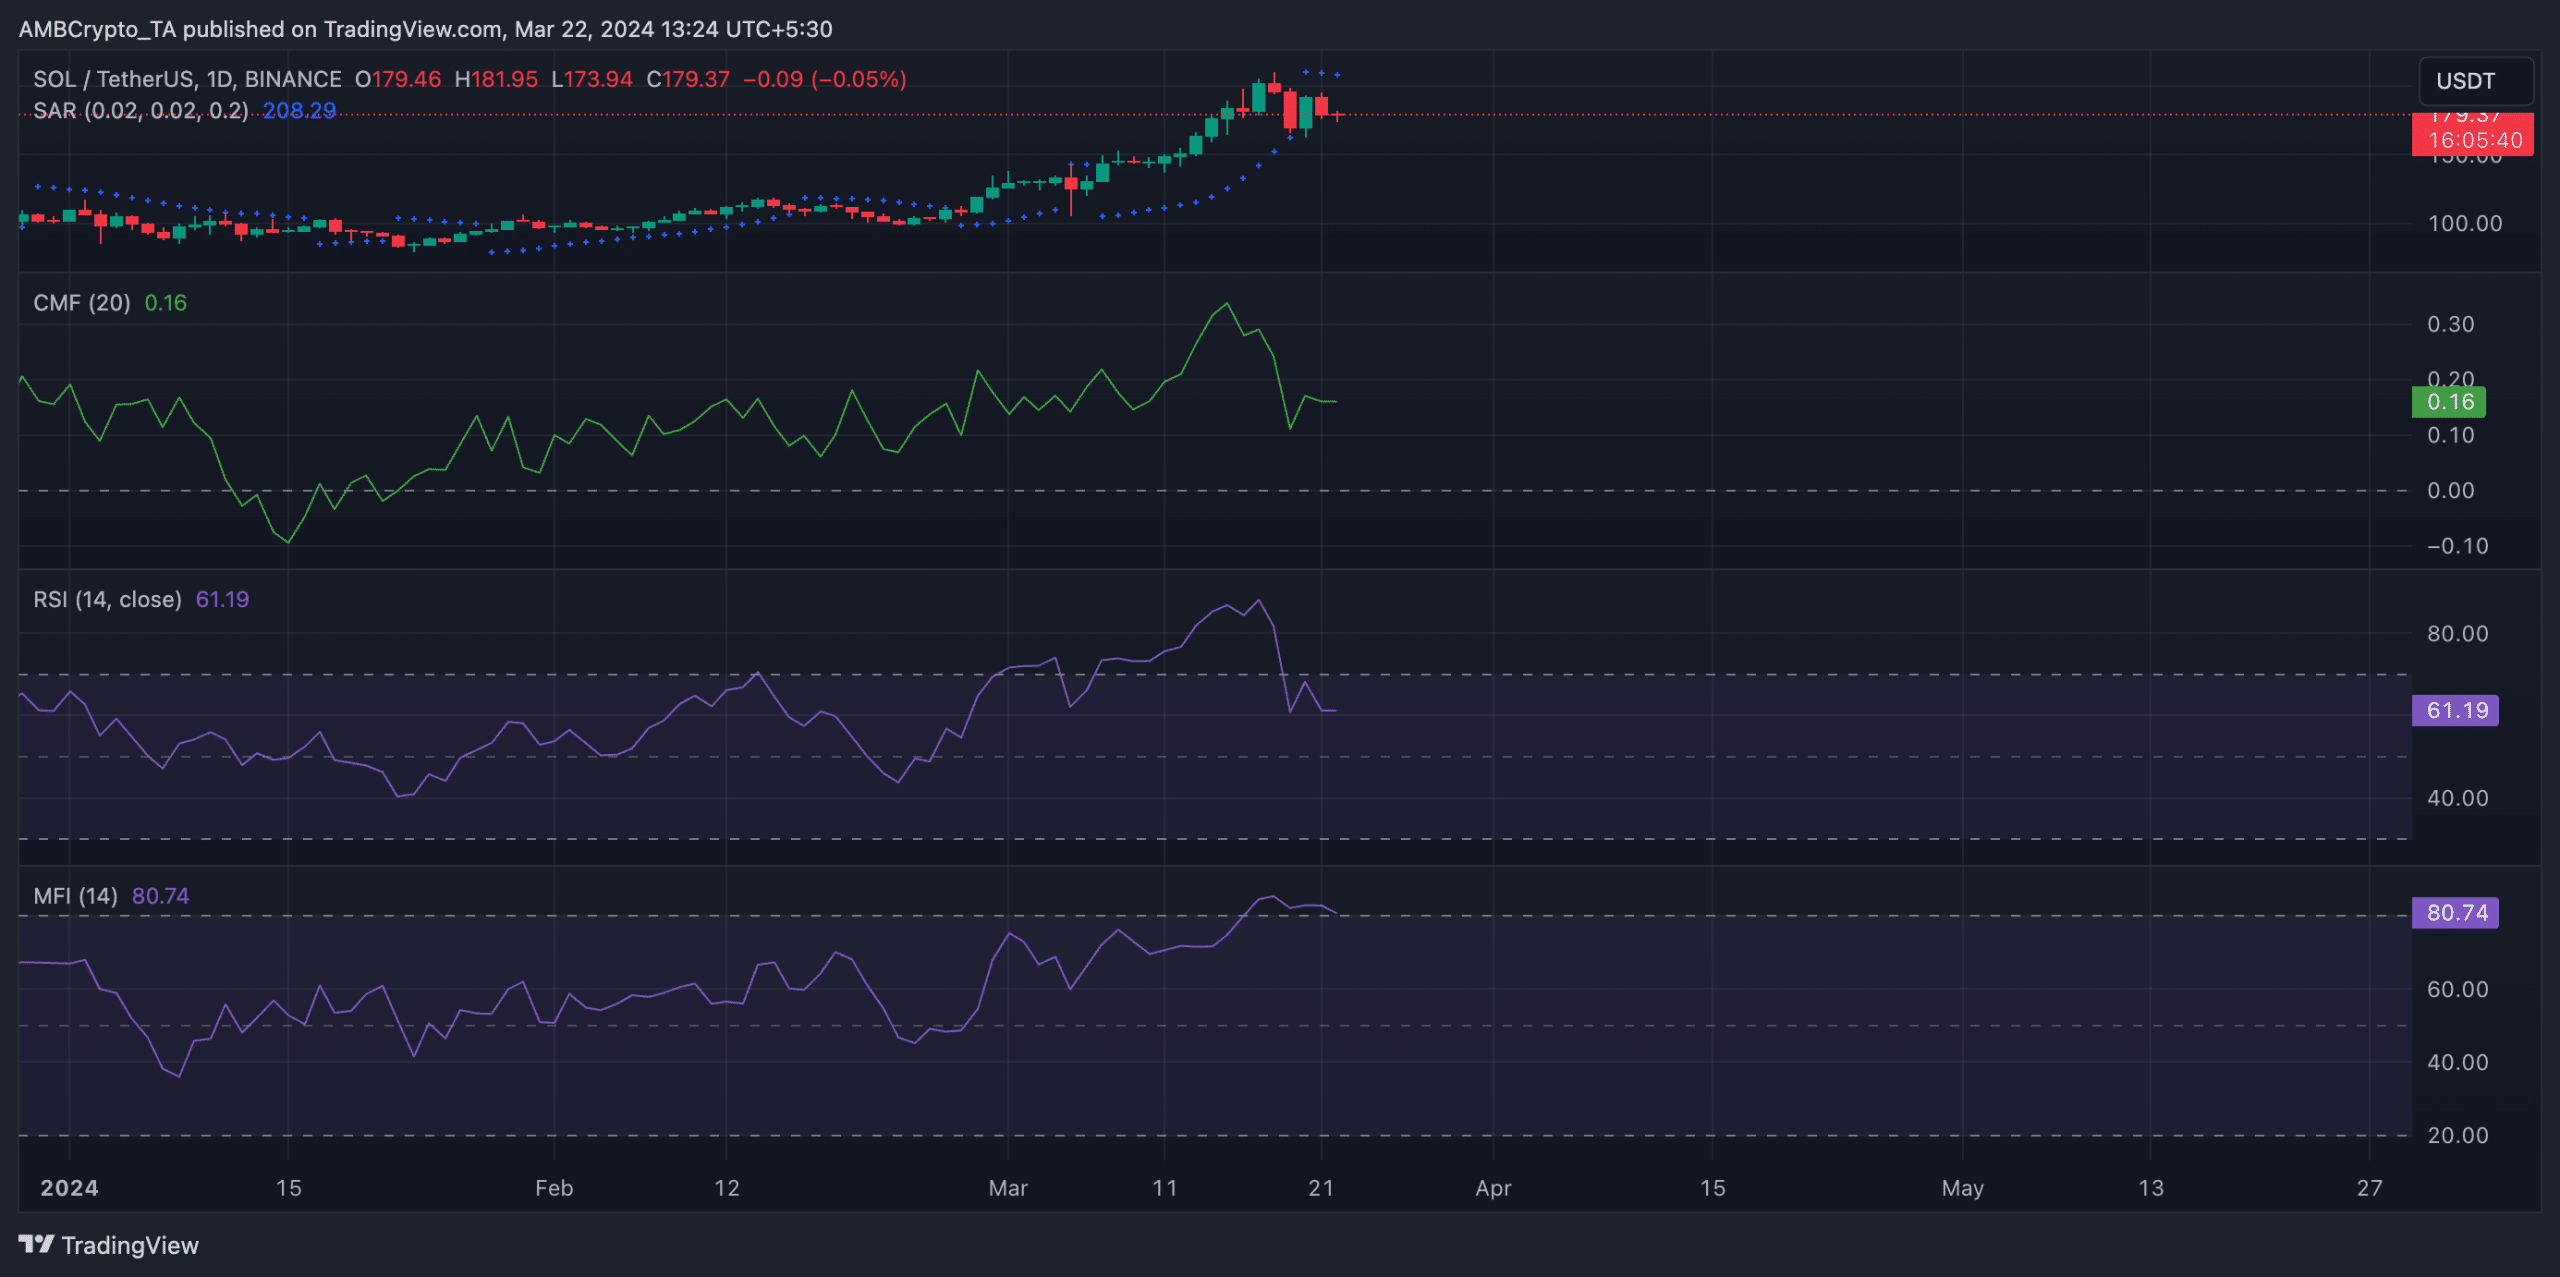
Source: TradingView