Solana’s 20-Day EMA crossover – Here’s what it means for SOL’s price
Solana's price has been doing well on the charts lately. What does that mean for you though?

- SOL’s price rallied above its 20-day EMA on the charts on 15 May
- This pointed to a decline in selling pressure
Solana’s [SOL] price crossed above its 20-day Exponential Moving Average (EMA) during the intraday trading session on 15 May. This pointed to an uptick in new demand for the altcoin.
This crossover is notable because it confirmed that SOL’s prevailing price rallied past its average price over the last 20 days. It also marked a shift towards buying momentum and a possible uptrend in the altcoin’s price.
SOL prepares for more
At press time, SOL was valued at $163.28, logging a 13% price rally over the last 24 hours. Its key technical indicators assessed on a 1-day chart confirmed the possibility that the altcoin may sustain this rally in the short term.
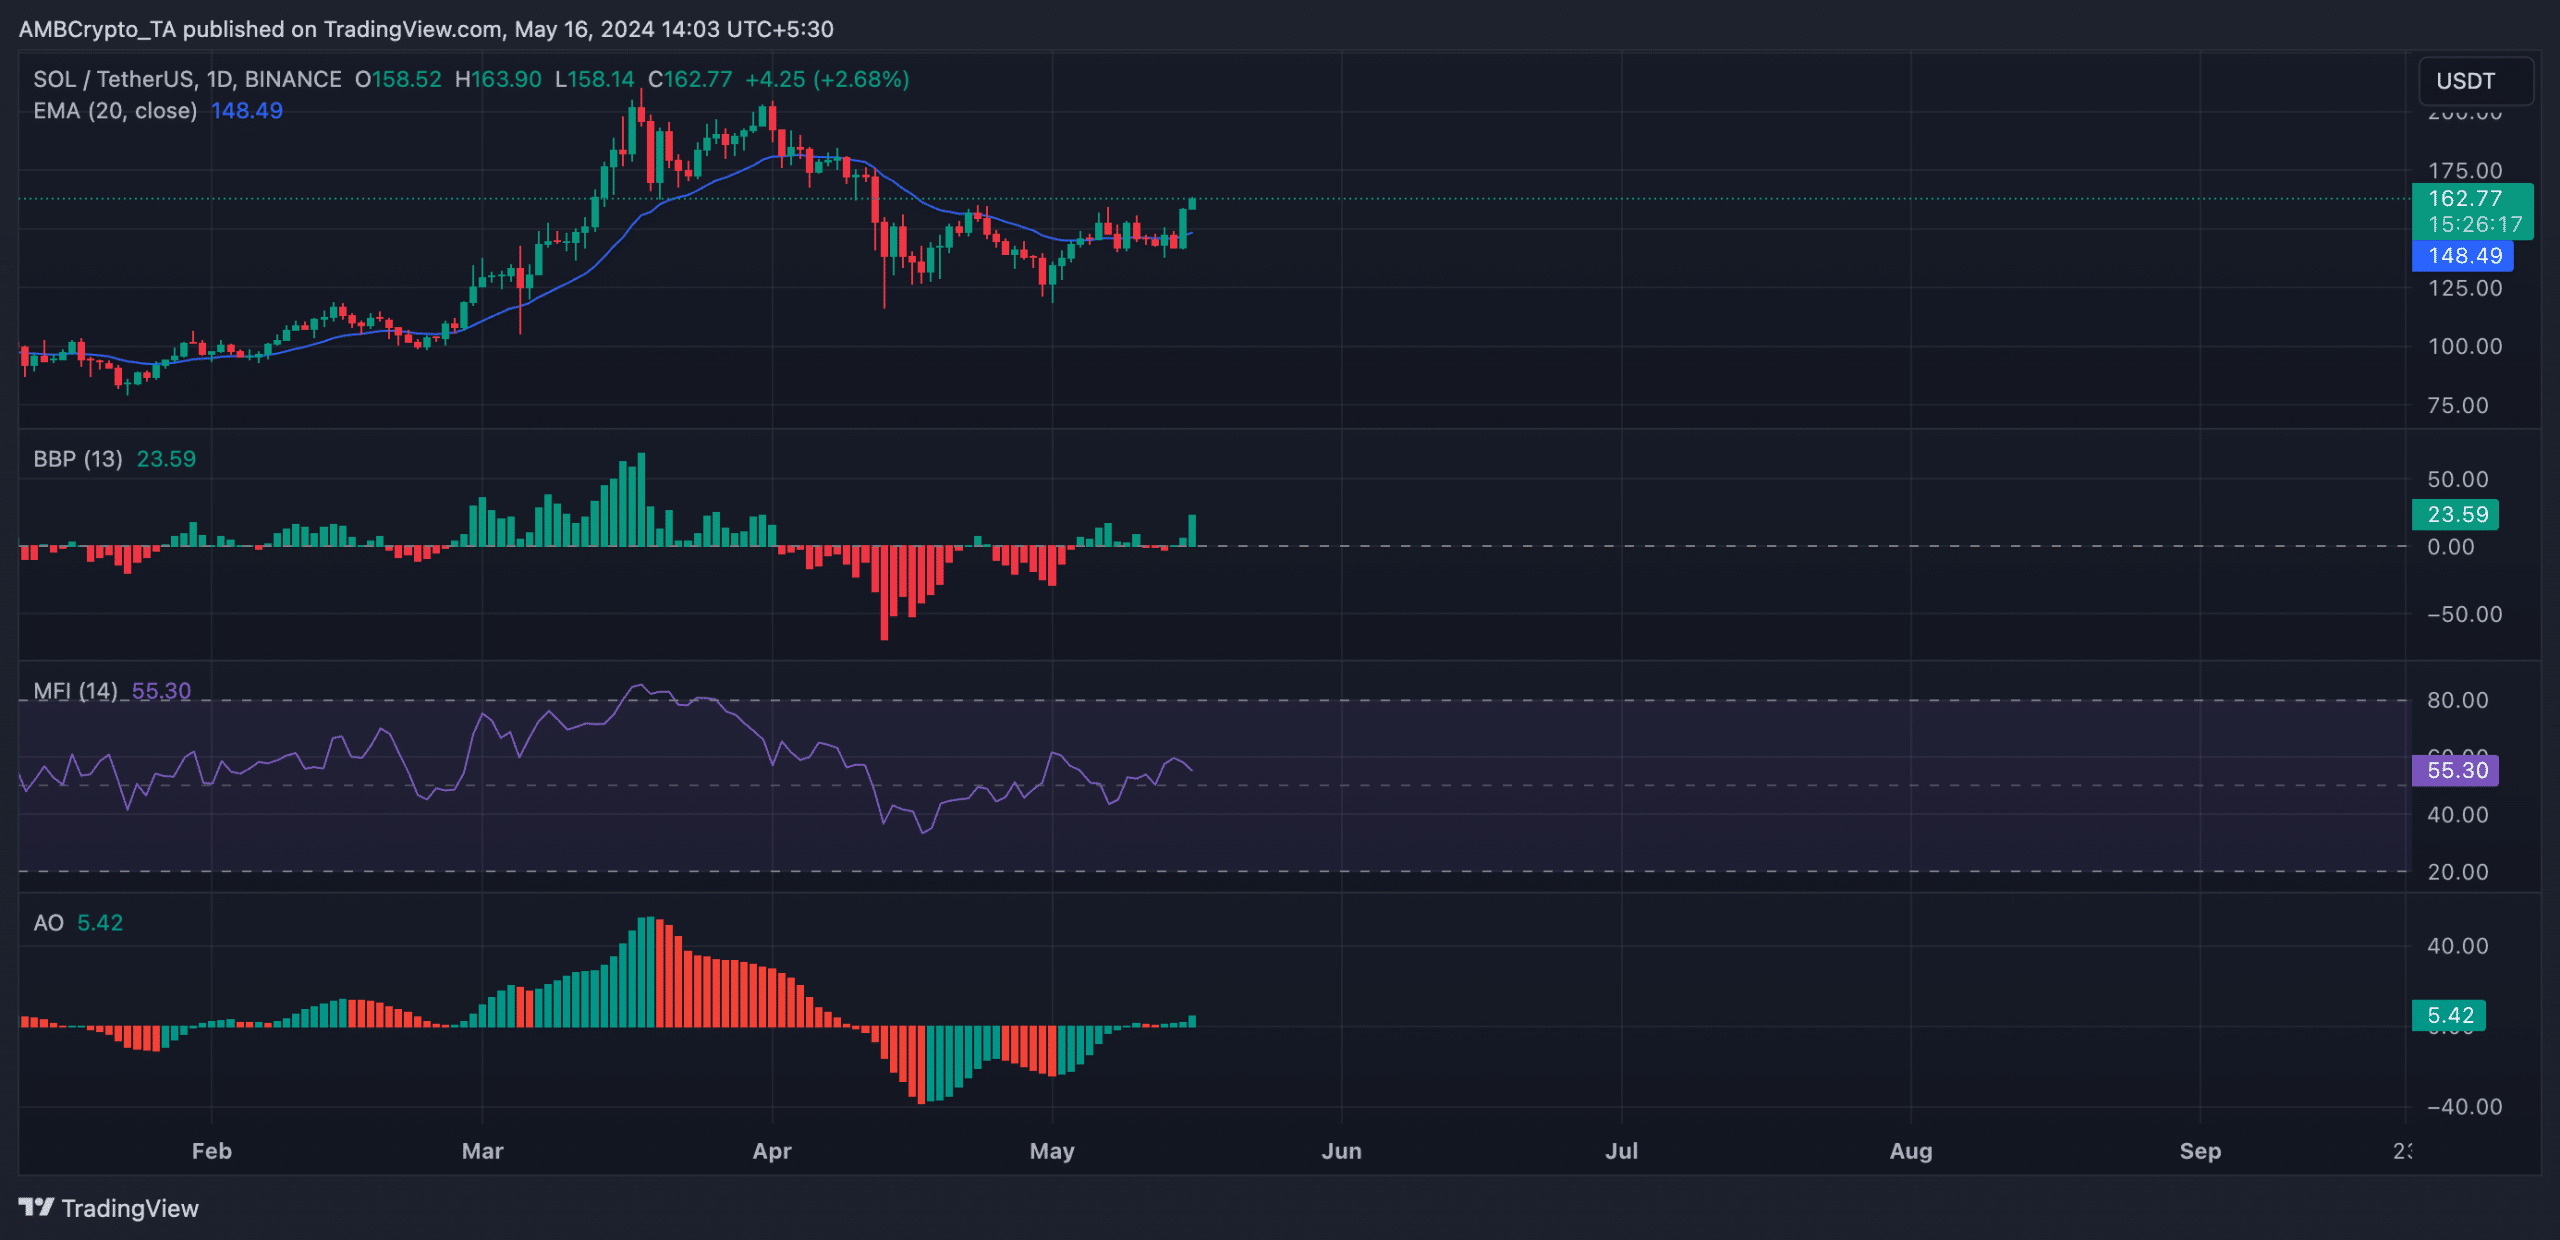
First of all, signaling a hike in buying pressure, SOL’s Relative Strength Index (RSI) was on an uptrend with a reading of 59.20 at press time. Also, its Money Flow Index (MFI) was 55.29.
The values of these indicators confirmed SOL traders’ preference for accumulation over selling off their holdings for profit.
Furthermore, the coin’s Awesome Oscillator posted green upward-facing bars, confirming the bullish trend at press time.
This indicator measures an asset’s market momentum and identifies potential trend reversals in its price. Green upward-facing bars, often seen after a period of consolidation or a pullback, indicate that the buyers are taking control of the market and that the asset’s price rally might continue.
The coin’s Elder-Ray Index was also positive, lending credence to the aforementioned position. At press time, it had a reading of 23.59, showing that bull power was dominant in SOL’s market.
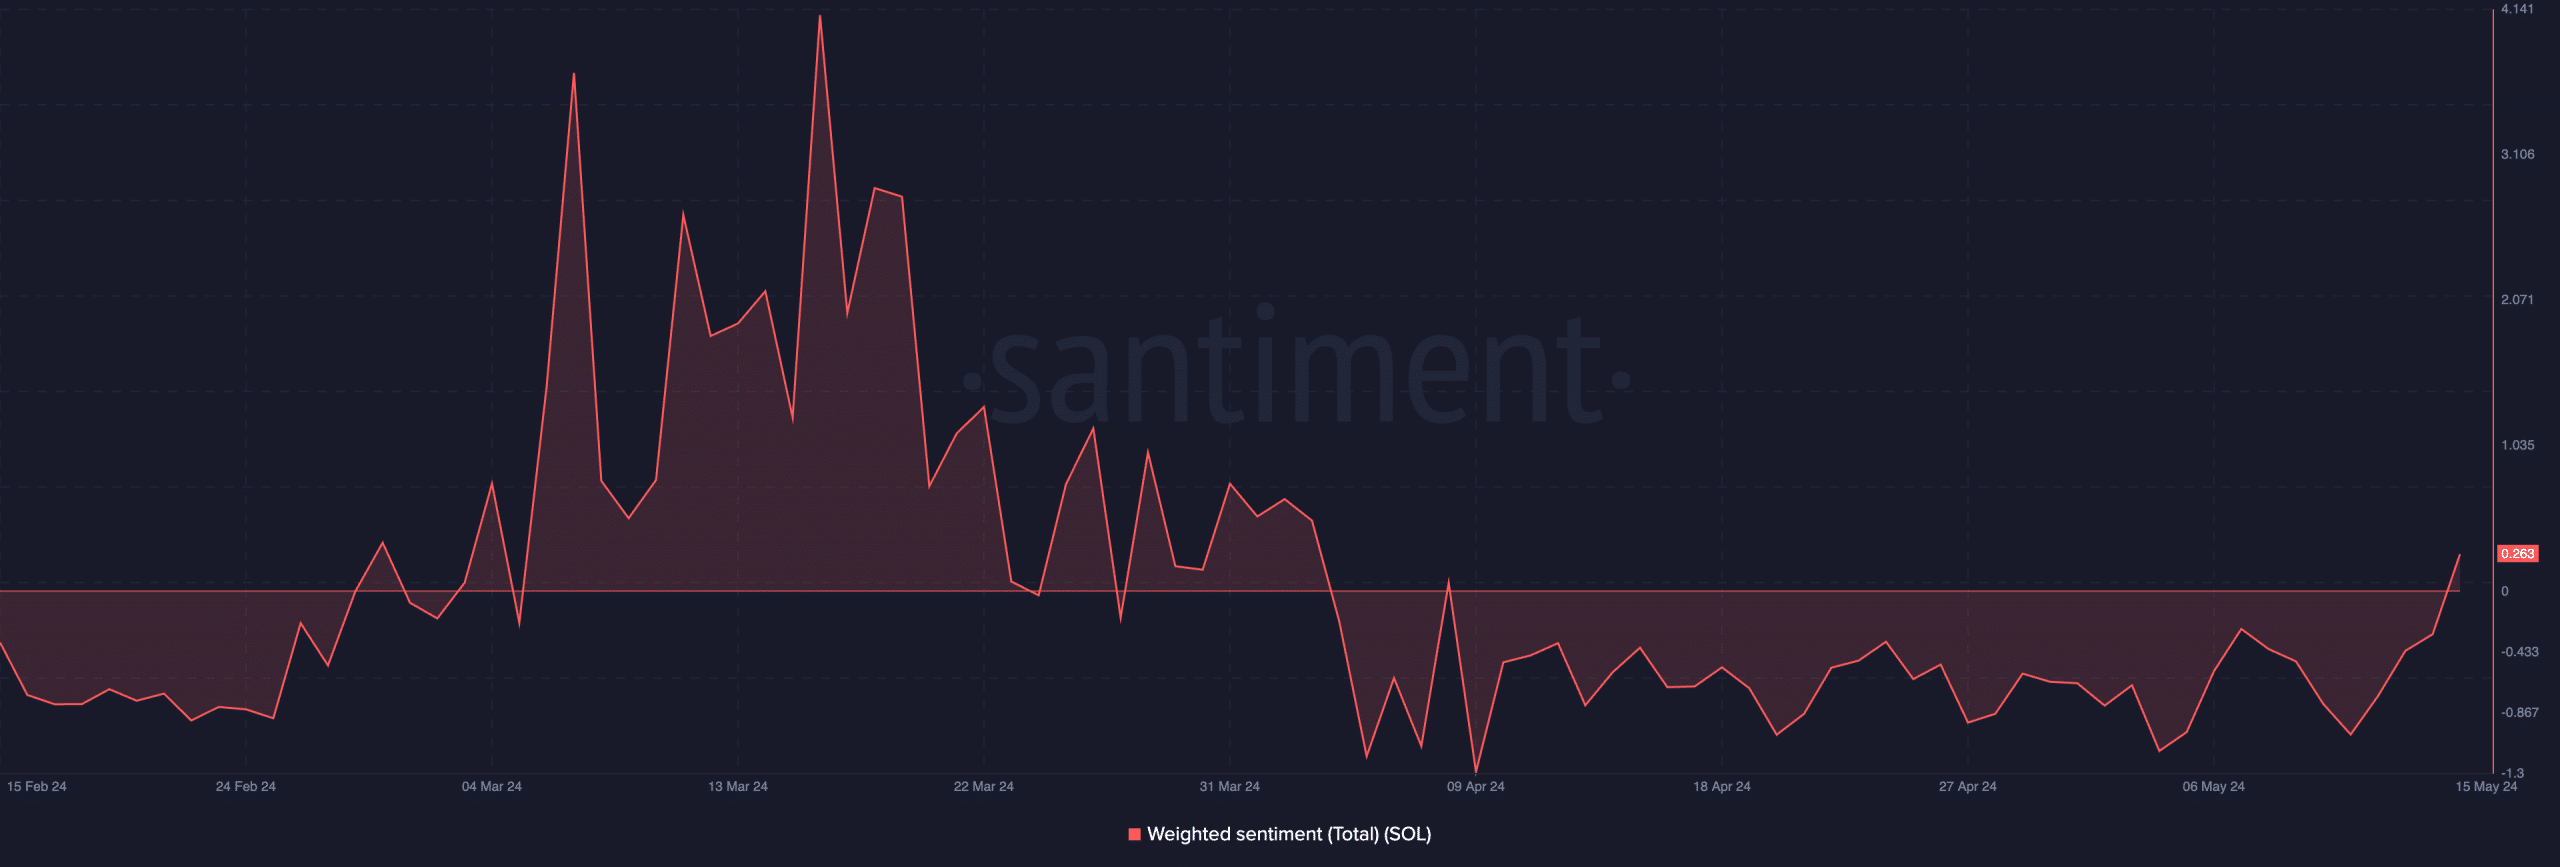
Highlighting the growth in the bullish trend since the crossover, SOL’s weighted sentiment turned positive for the first time since 4 April too.
In fact, according to Santiment’s data, the coin’s weighted sentiment was 0.263 at the time of writing.
Realistic or not, here’s SOL’s market cap in BTC’s terms
Do not get carried away
A hike in market volatility has also accompanied the sudden increase in new demand for SOL. Readings from the coin’s Bollinger Bands revealed that the gap between the indicator’s upper and lower bands has begun expanding.
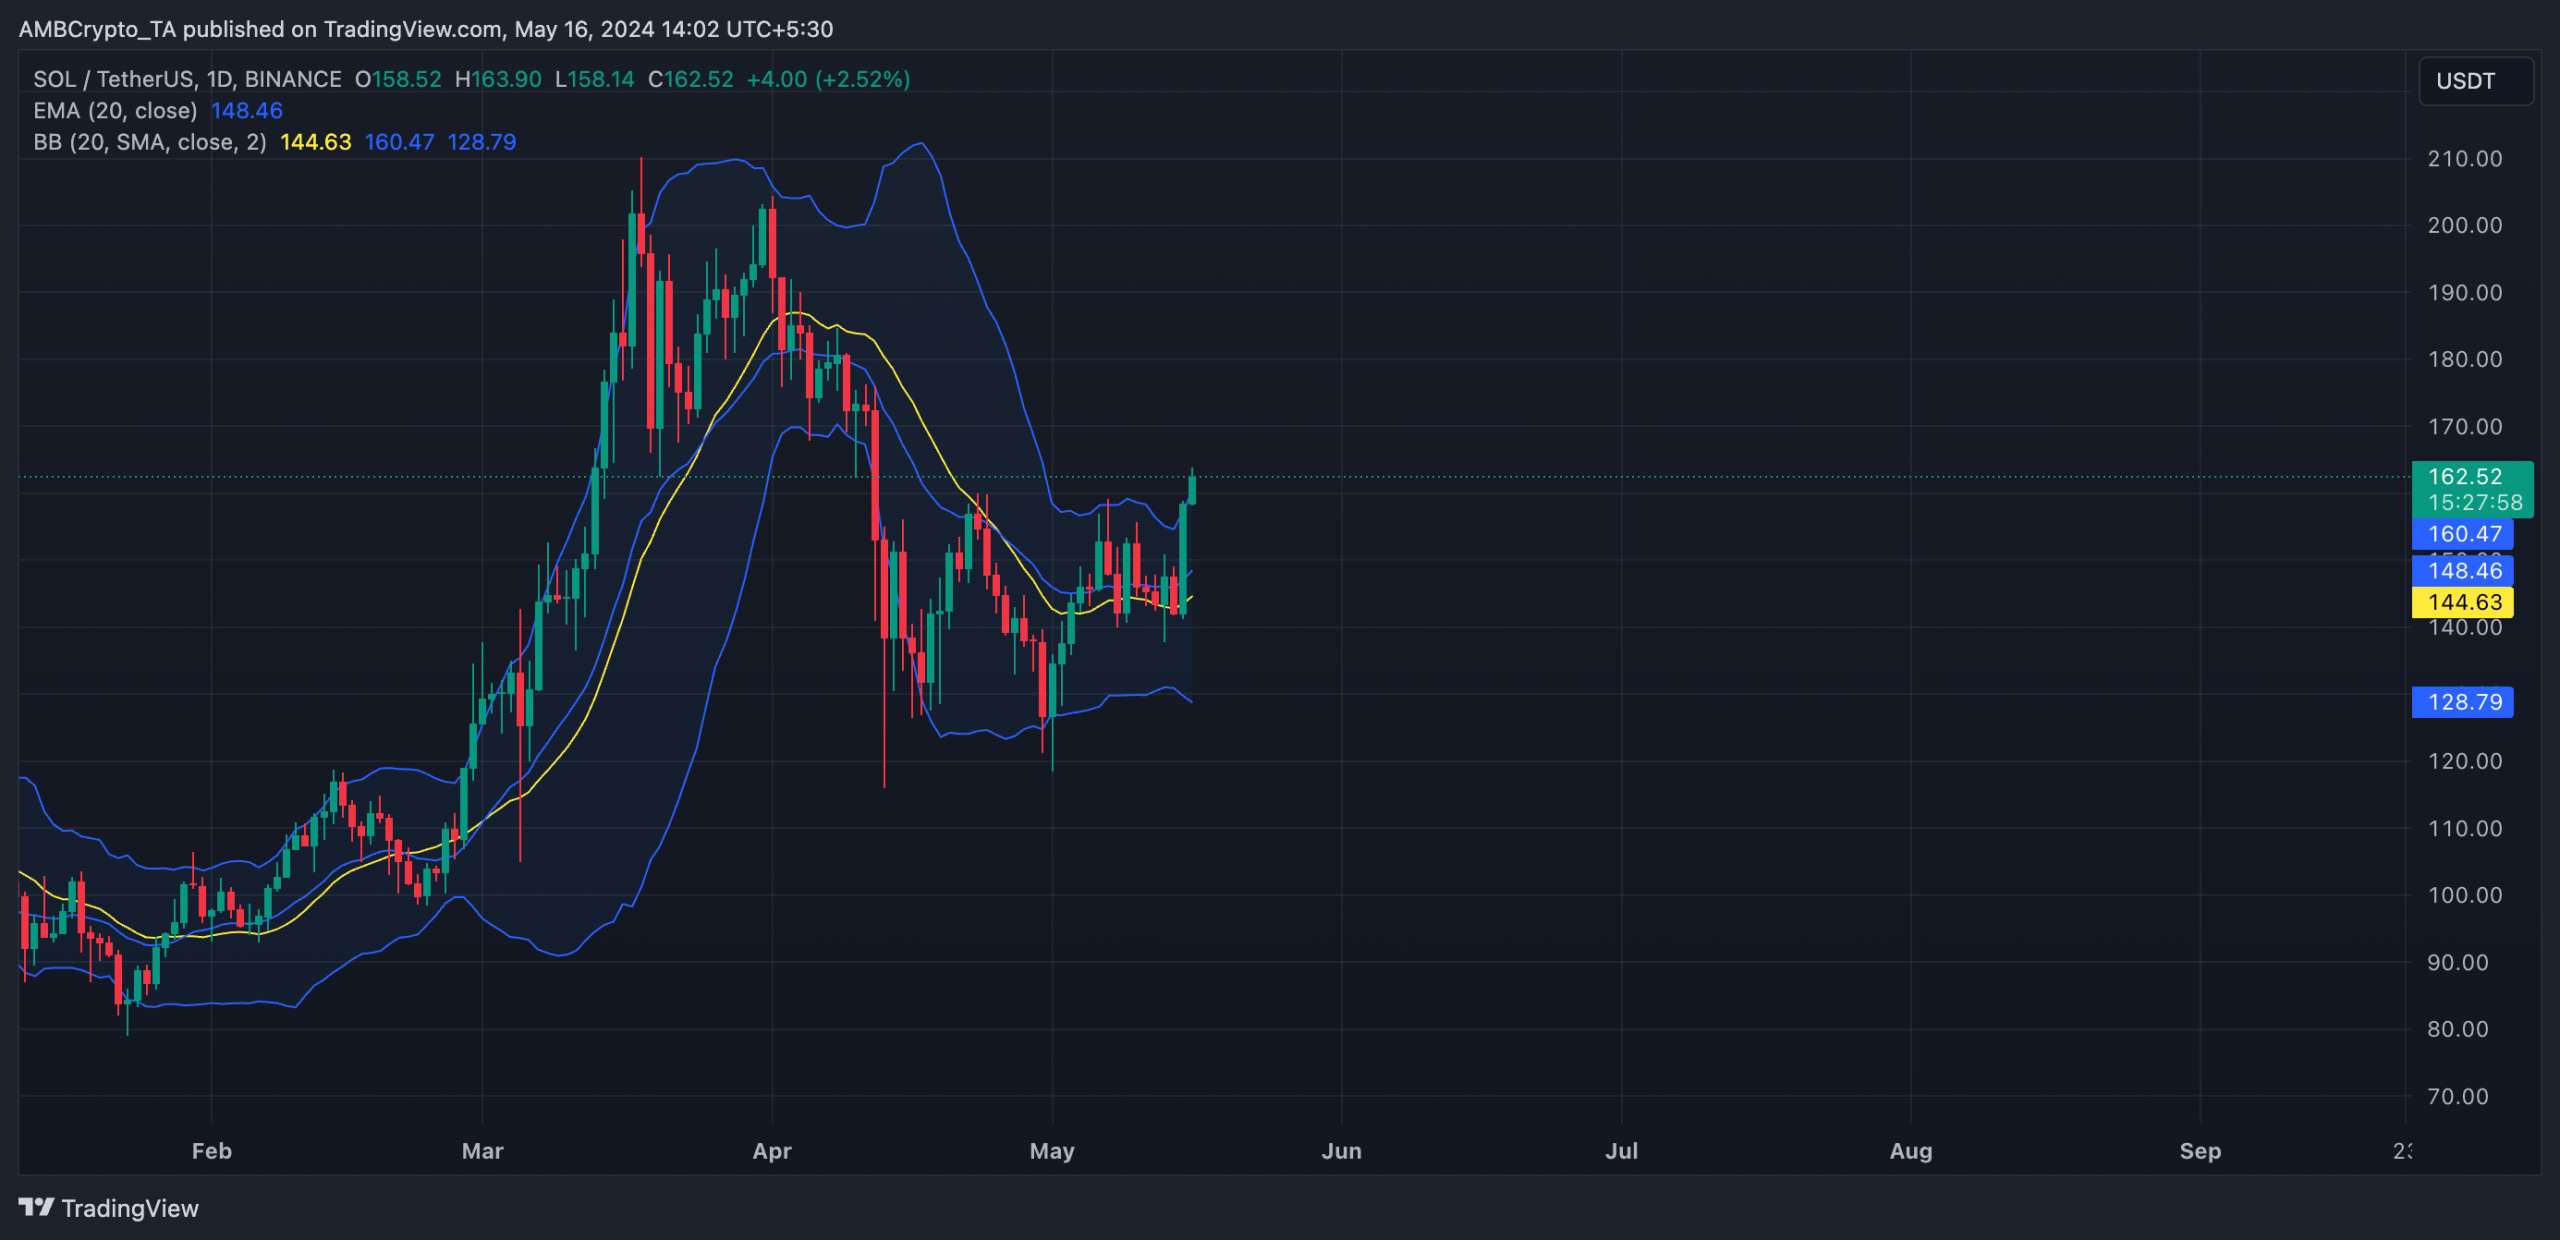
When the gap between these bands widens in this manner, the crypto-asset’s price becomes more volatile and may record swings in either direction.


