Solana’s future looks quite promising but only if these metrics change course

Solana’s [SOL] ecosystem was quite active last week considering the announcement of several promising developments. Most recently, Google Cloud tweeted that it was working with Solana to bring Blockchain Node Engine to the Solana chain next year. This partnership would help anyone looking to launch a dedicated Solana node in the cloud.
Did you think we only had one announcement? Think again.
Google Cloud is working with @solana to bring Blockchain Node Engine to the Solana chain next year, so it will be easy for anyone to launch a dedicated Solana node in the cloud ↓ https://t.co/CzrM90fQpp
— Google Cloud (@googlecloud) November 5, 2022
____________________________________________________________________________________________
Here’s AMBCrypto’s Price Prediction for Solana [SOL] for 2023-24
____________________________________________________________________________________________
The official announcement said,
“While self-managed nodes are often difficult to deploy and require constant management, Blockchain Node Engine is a fully managed node-hosting service that can minimize the need for node operations.”
SOL’s DeFi space also witnessed a considerable amount of updates. Notably, JupiterExchange integrated Solana’s transactions v2, and Solanamobile allowed Saga pre-ordered users to mint the Saga Pass NFT.
Solana DeFi Highlight Week 44
🔸 @SolanaFndn released the @Solana Network Performance Report
🔸 @solanamobile allowed Saga pre-odered users mint Saga Pass NFT
🔸 @JupiterExchange has integrated Solana’s transactions v2
(1/2) pic.twitter.com/zR12OW0TNM
— Solana Daily (@solana_daily) November 6, 2022
Interestingly, Solana’s chart was also painted green considering last week as it registered over 8% weekly gains. A look at SOL’s metrics also signaled towards a optimistic future, as most of them supported a continued price surge.
SOL showcases an uptick
On the metric front, Solana received significant interest from the derivatives market as its Binance funding rate was notably high.
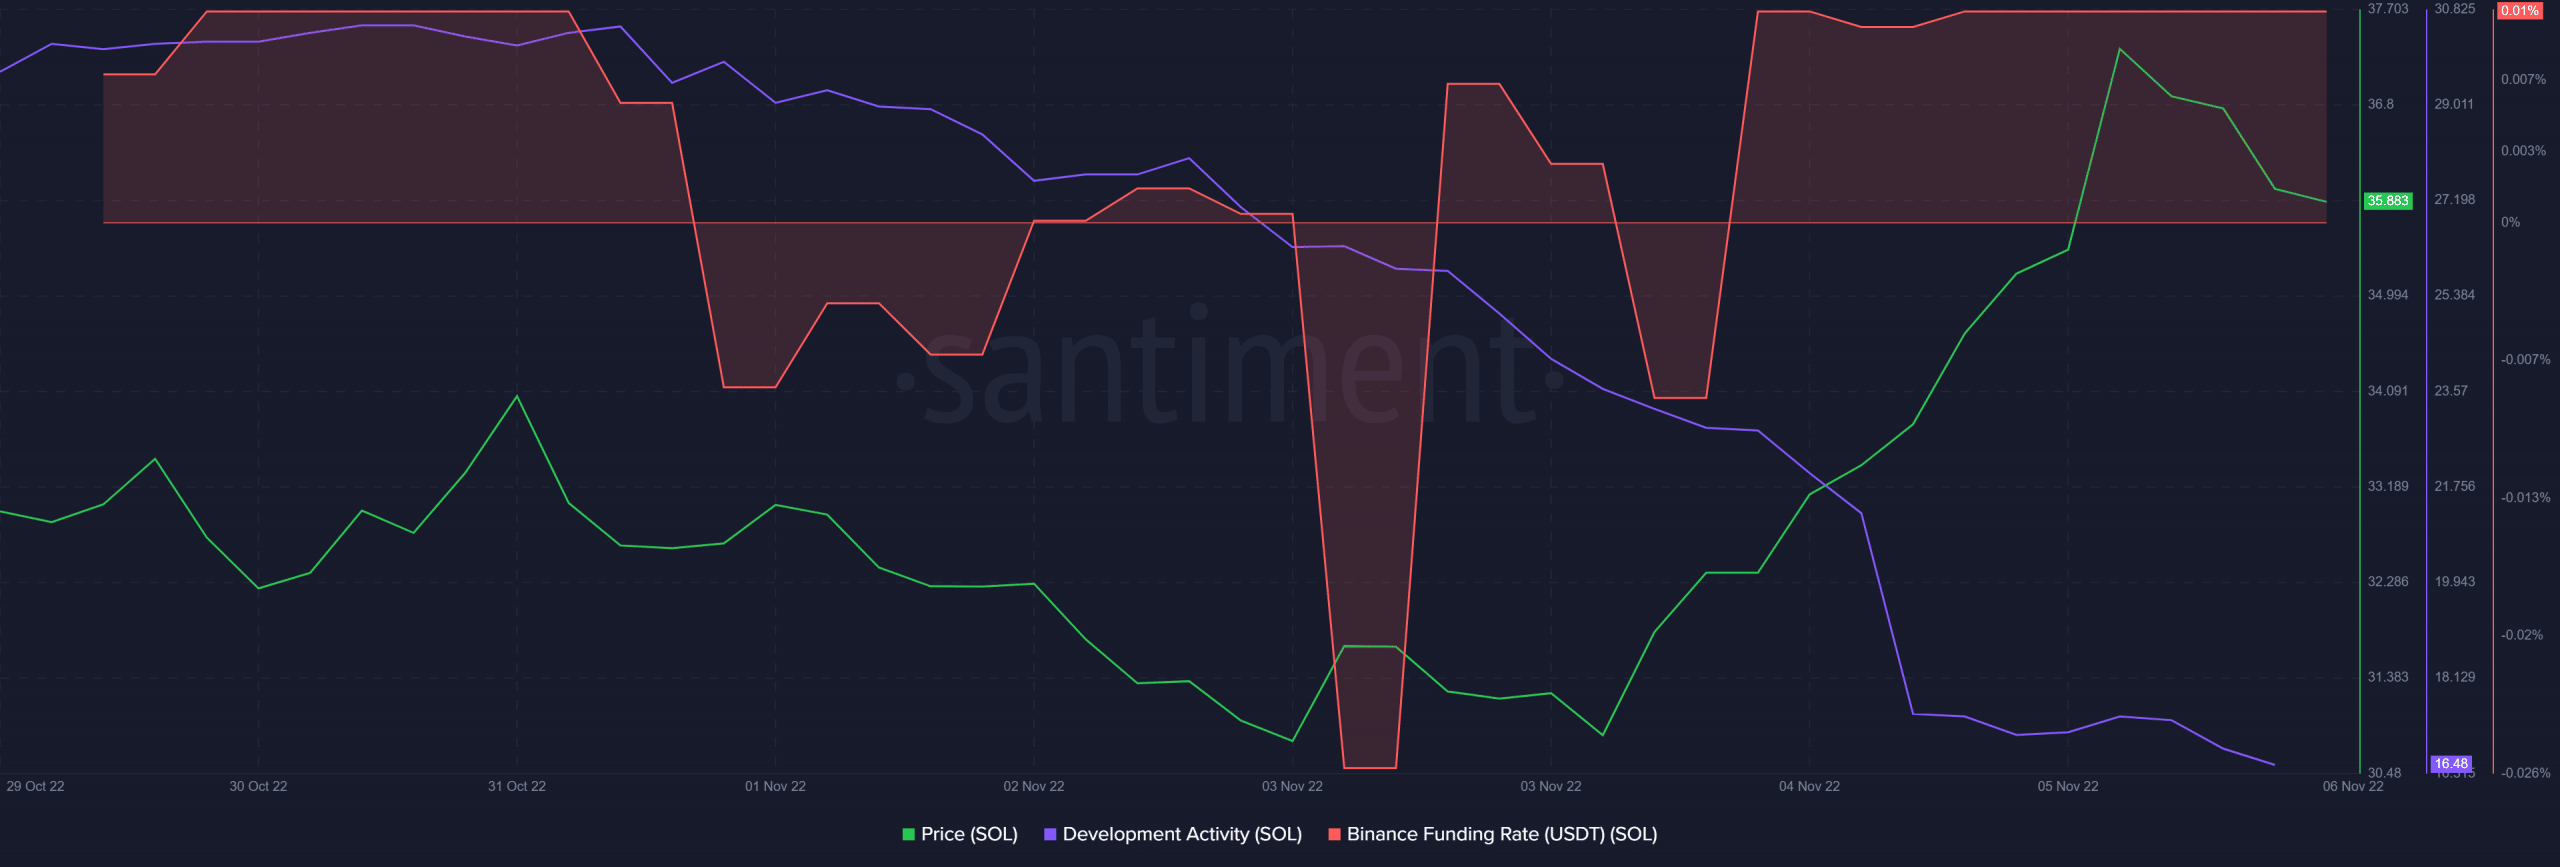
According to DeFiLlama, SOL’s total value locked (TVL) registered an uptick lately. Its NFT trade counts spiked on 1 and 4 November, indicating another price surge in the coming days.
However, despite these updates and integrations, SOL’s development activity went the opposite way and declined over the last week. This could be considered as a negative signal for a blockchain. However, SOL’s market indicators could help us understand the scenario better.
Bulls or bears?
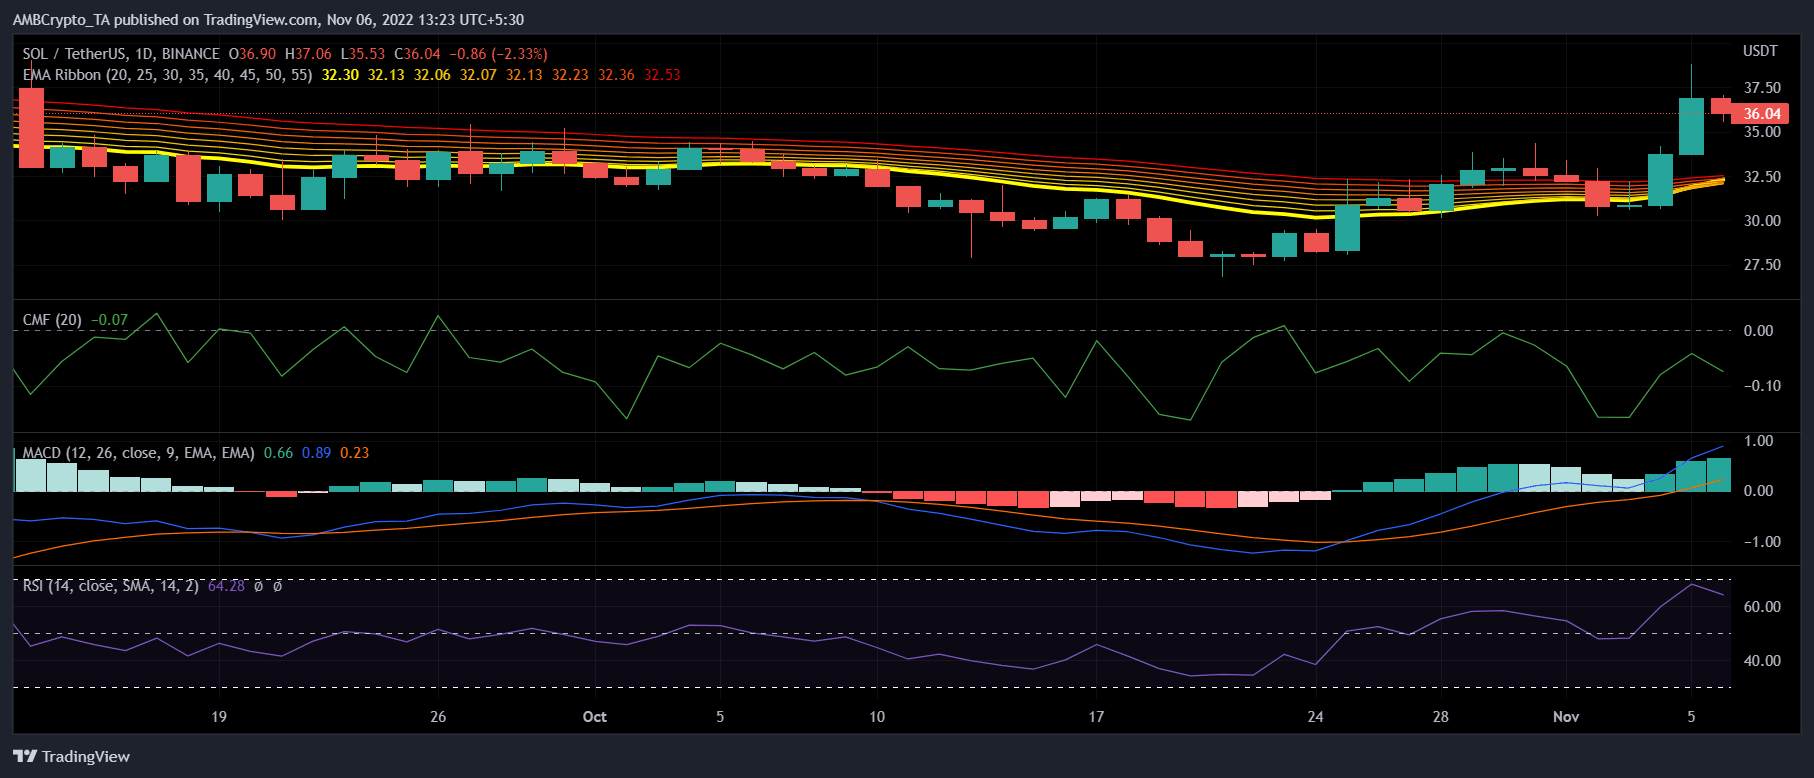
SOL’s Moving Average Convergence Divergence (MACD) indicator displayed a recent bullish crossover. This could offer some respite to troubled investors. Not only this, but the Exponential Moving Average (EMA) Ribbon revealed the possibility of another upcoming bullish crossover. Thus, increasing the chances of an uptrend.
However, the Relative Strength Index (RSI) and Chaikin Money Flow (CMF) registered downticks. This could act as a roadblock in the in SOL’s overall bullish score.