Solana’s key metrics grow, but there’s a catch
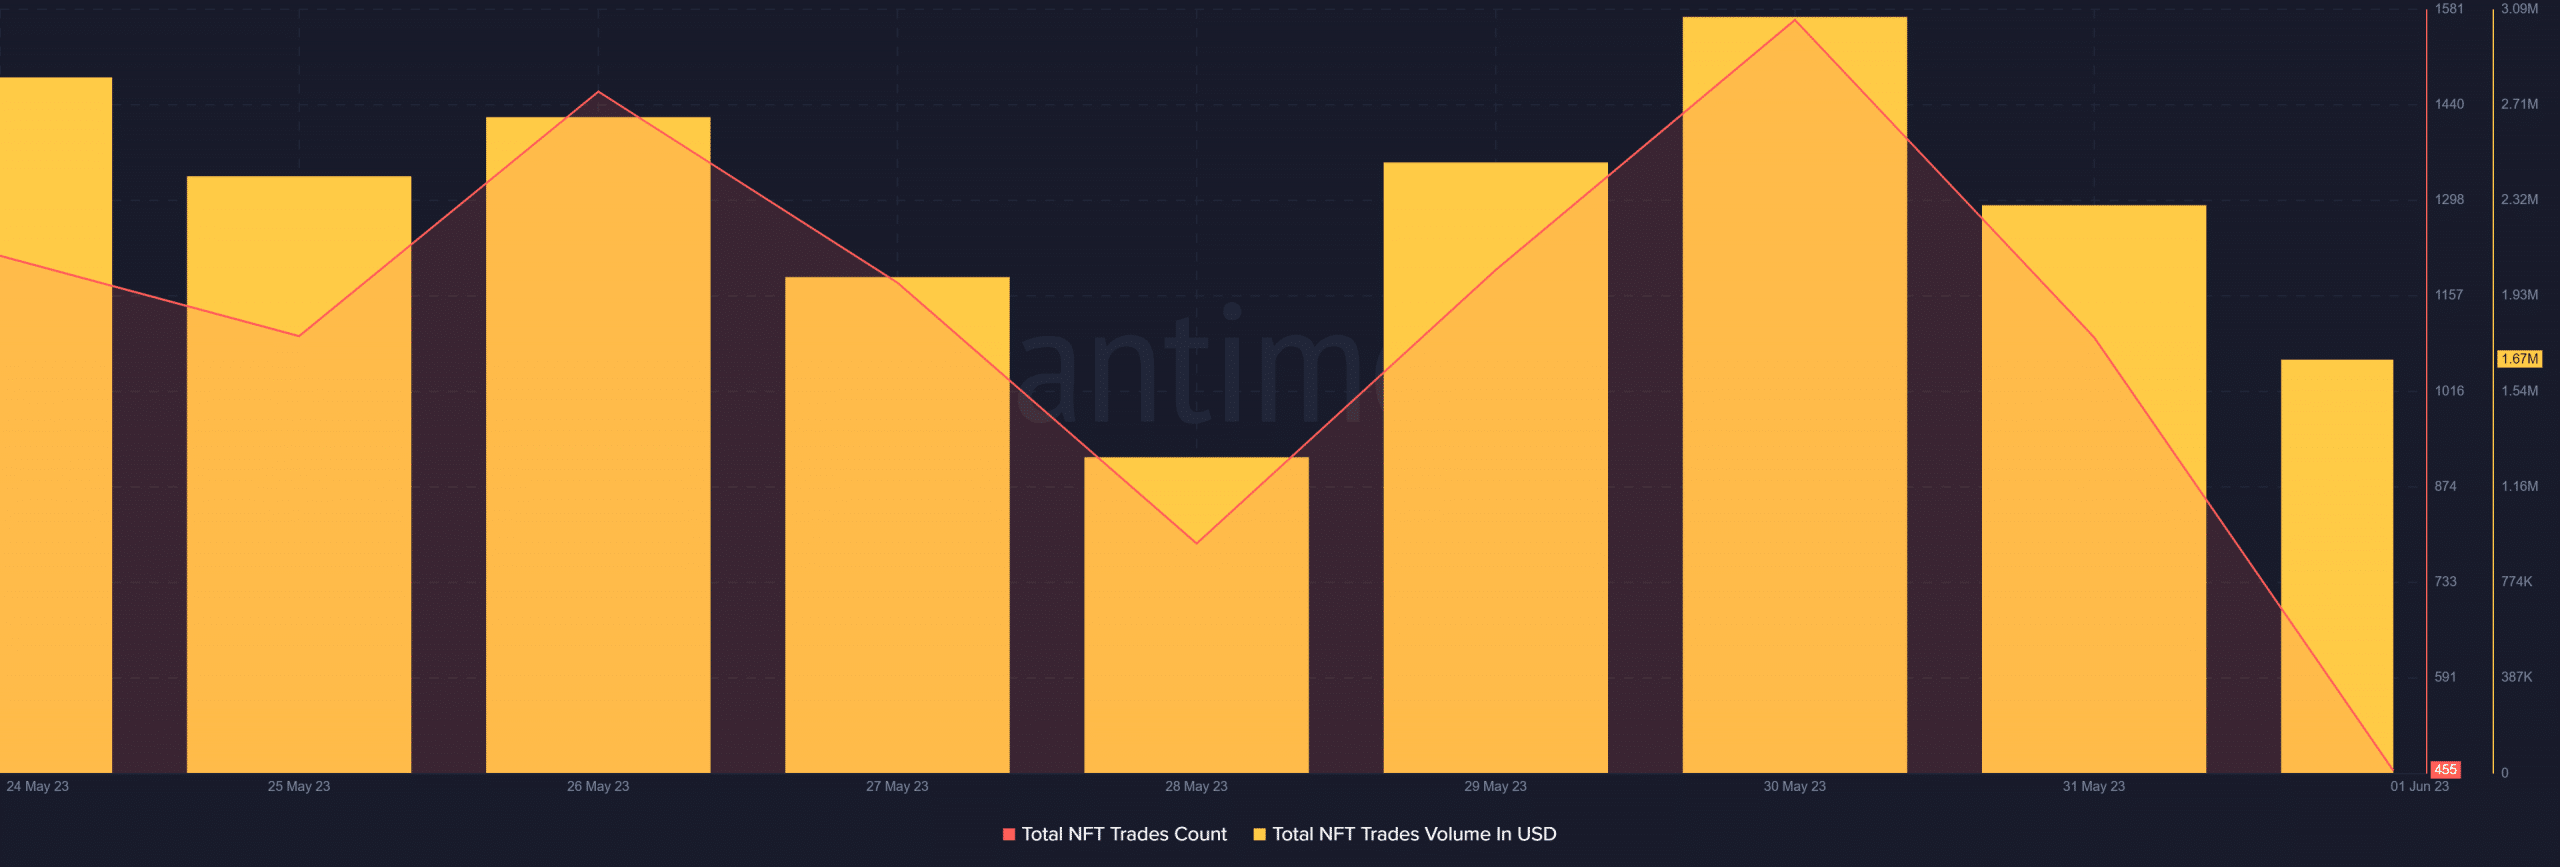
Solana’s NFT trade count and trade volume in USD both spiked in the last seven days.

- SOL’s TVL and DEX volumes registered upticks, which looked encouraging.
- Despite a green weekly chart, SOL’s market indicators remained bearish.
Solana’s [SOL] Magic Eden has become the top performing NFT player in its ecosystem. The network’s NFT metrics also went green last week, as evident from CRYPTOSLAM’s charts.
As per the data, the number of NFT sellers and buyers both went up by more than 20% in the last seven days. Not only that, but the number of transactions also increased marginally.

The same growth was also noted on Santiment’s chart as SOL’s NFT trade counts registered an uptick. Its NFT trade volume in USD also spiked, further reflecting growth in the NFT ecosystem.
Solana NFT ecosystem is growing along
Solana noted growth on other fronts as well. For instance, after a dip, SOL’s daily transactions gained upward momentum.
Additionally, its DEX volume also spiked, reflecting its popularity among traders. Artemis’ data revealed that Solana’s TVL also increased in the last few days, which by and large is a positive signal for a blockchain.

Investors’ confidence improved
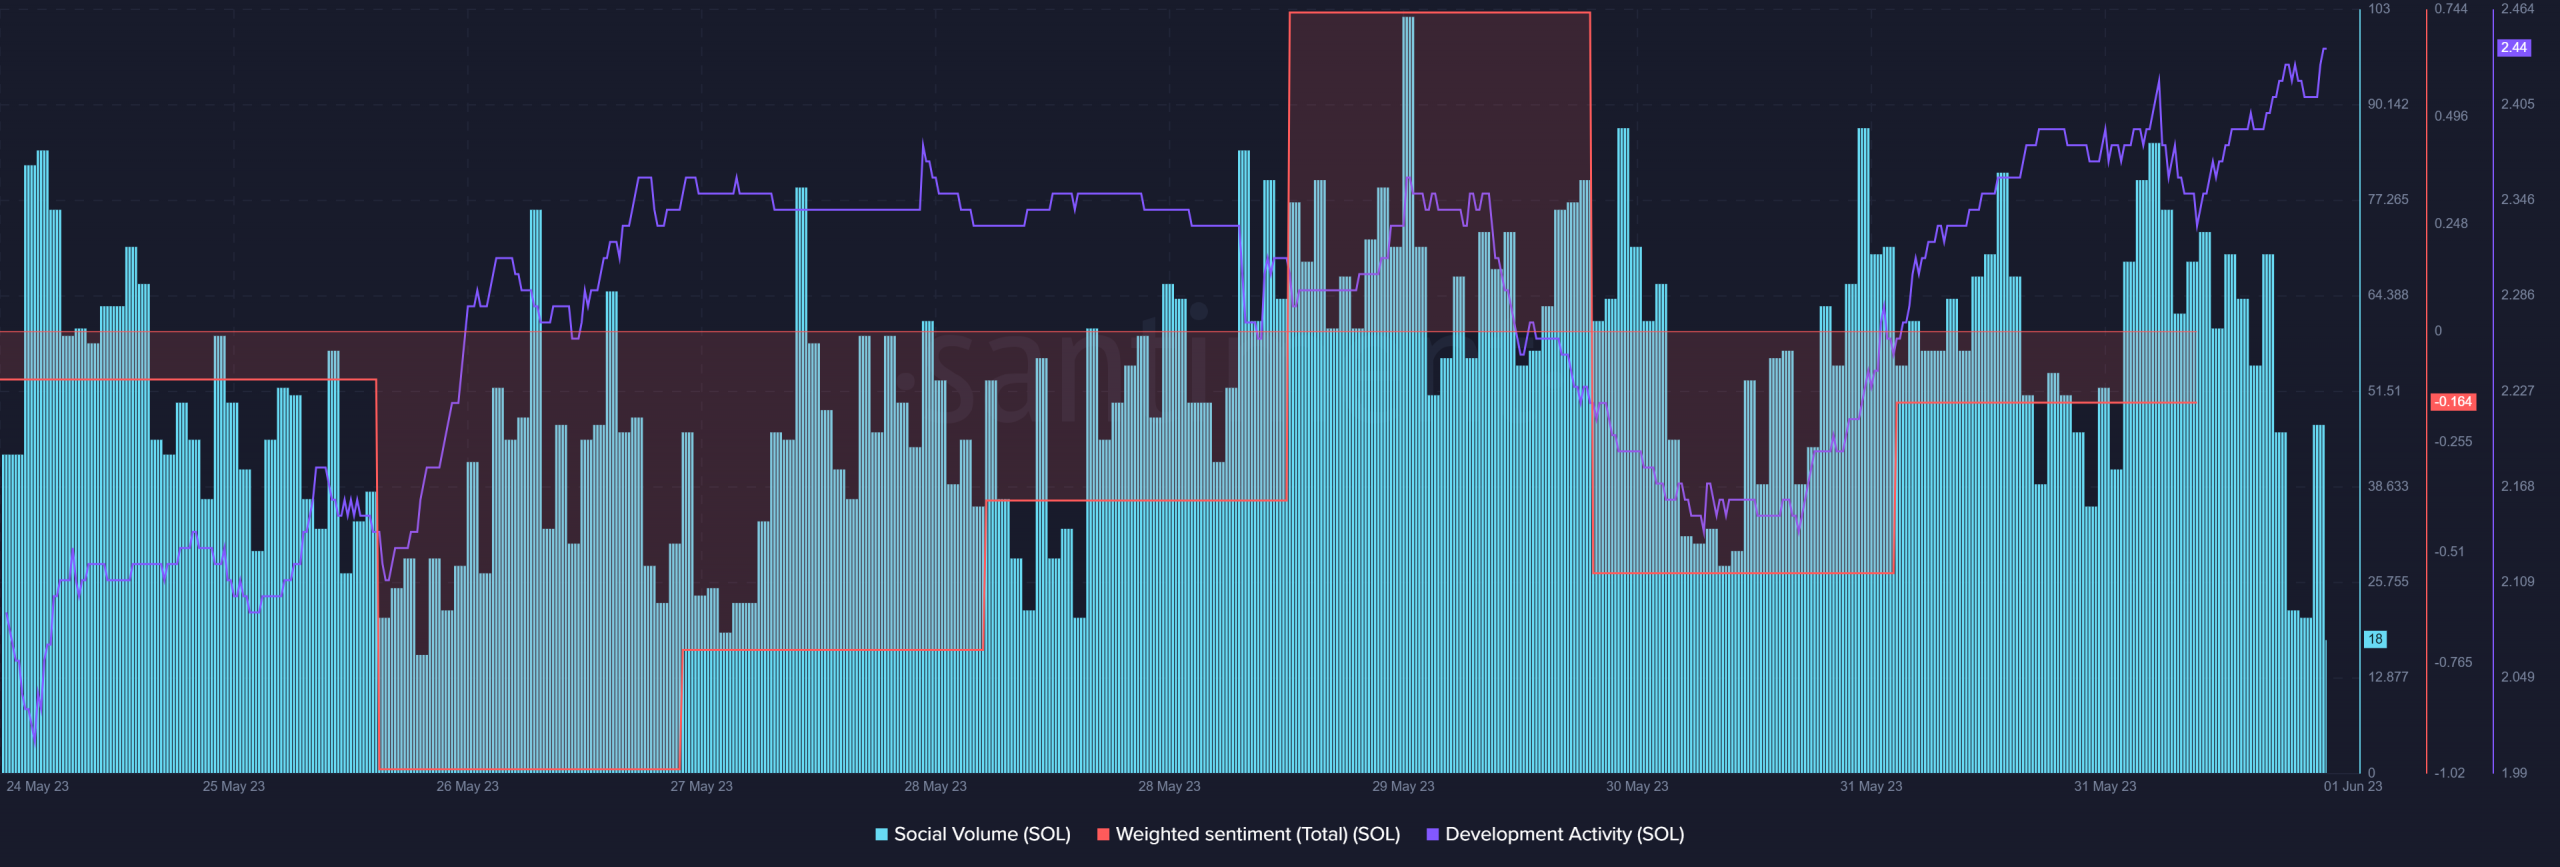
The improvement in the metrics might also have played a role in improving sentiment around SOL in the market. After a dip, Solana’s weighted sentiments registered an uptick, which is a positive signal.
Moreover, its social volume also increased, again reflecting the token’s popularity in the crypto space. Interestingly, SOL’s development activity was also high, which indicated that the developers were pouring in more effort to improve the network.
Solana’s weekly chart is bullish
As per CoinMarketCap, SOL’s price increased by more than 6% in the last seven days, which was bullish. At the time of writing, SOL was trading at $20.68 with a market capitalization of over $8 billion, making Solana the 10th largest crypto by market cap.
SOL’s MACD gave hope for a further increase in price as it showed a bullish upper hand in the market.

Read Solana’s [SOL] Price Prediction 2023-24
However, the rest of the indicators were bearish on SOL. For instance, the Relative Strength Index was resting at the neutral mark. SOL’s Money Flow Index was also below the neutral zone.
The Chaikin Money Flow registered a downtick, further increasing the chances of a price dip. In addition to that SOL’s Exponential Moving Average (EMA) Ribbon also supported the bears as the 20-day EMA was below the 55-day EMA.