Solana’s price drops below $100 for 4 consecutive days: Is a recovery still possible?
Solana's November struggles continue, but are oversold signals and rising stablecoin adoption hinting that the worst is over?



Black October seems to be seeping its way into November as the price of Solana dropped below the $100 price threshold for the fourth consecutive day. At press time, too, SOL was trading at $92.95, though after a hike of 1.7% in the past 24 hours.
However, the weekly drop of 8.8% has ignited a fresh wave of concern in the crypto market. What is bothering the investors here is that this price fall was last seen in January 2024, post which the altcoin managed to reach a price level of $250.
Solana’s price tests $89.27
Needless to say, the RSI, which further fell below the 30 level in the oversold zone, added to the ongoing concern around the altcoin.
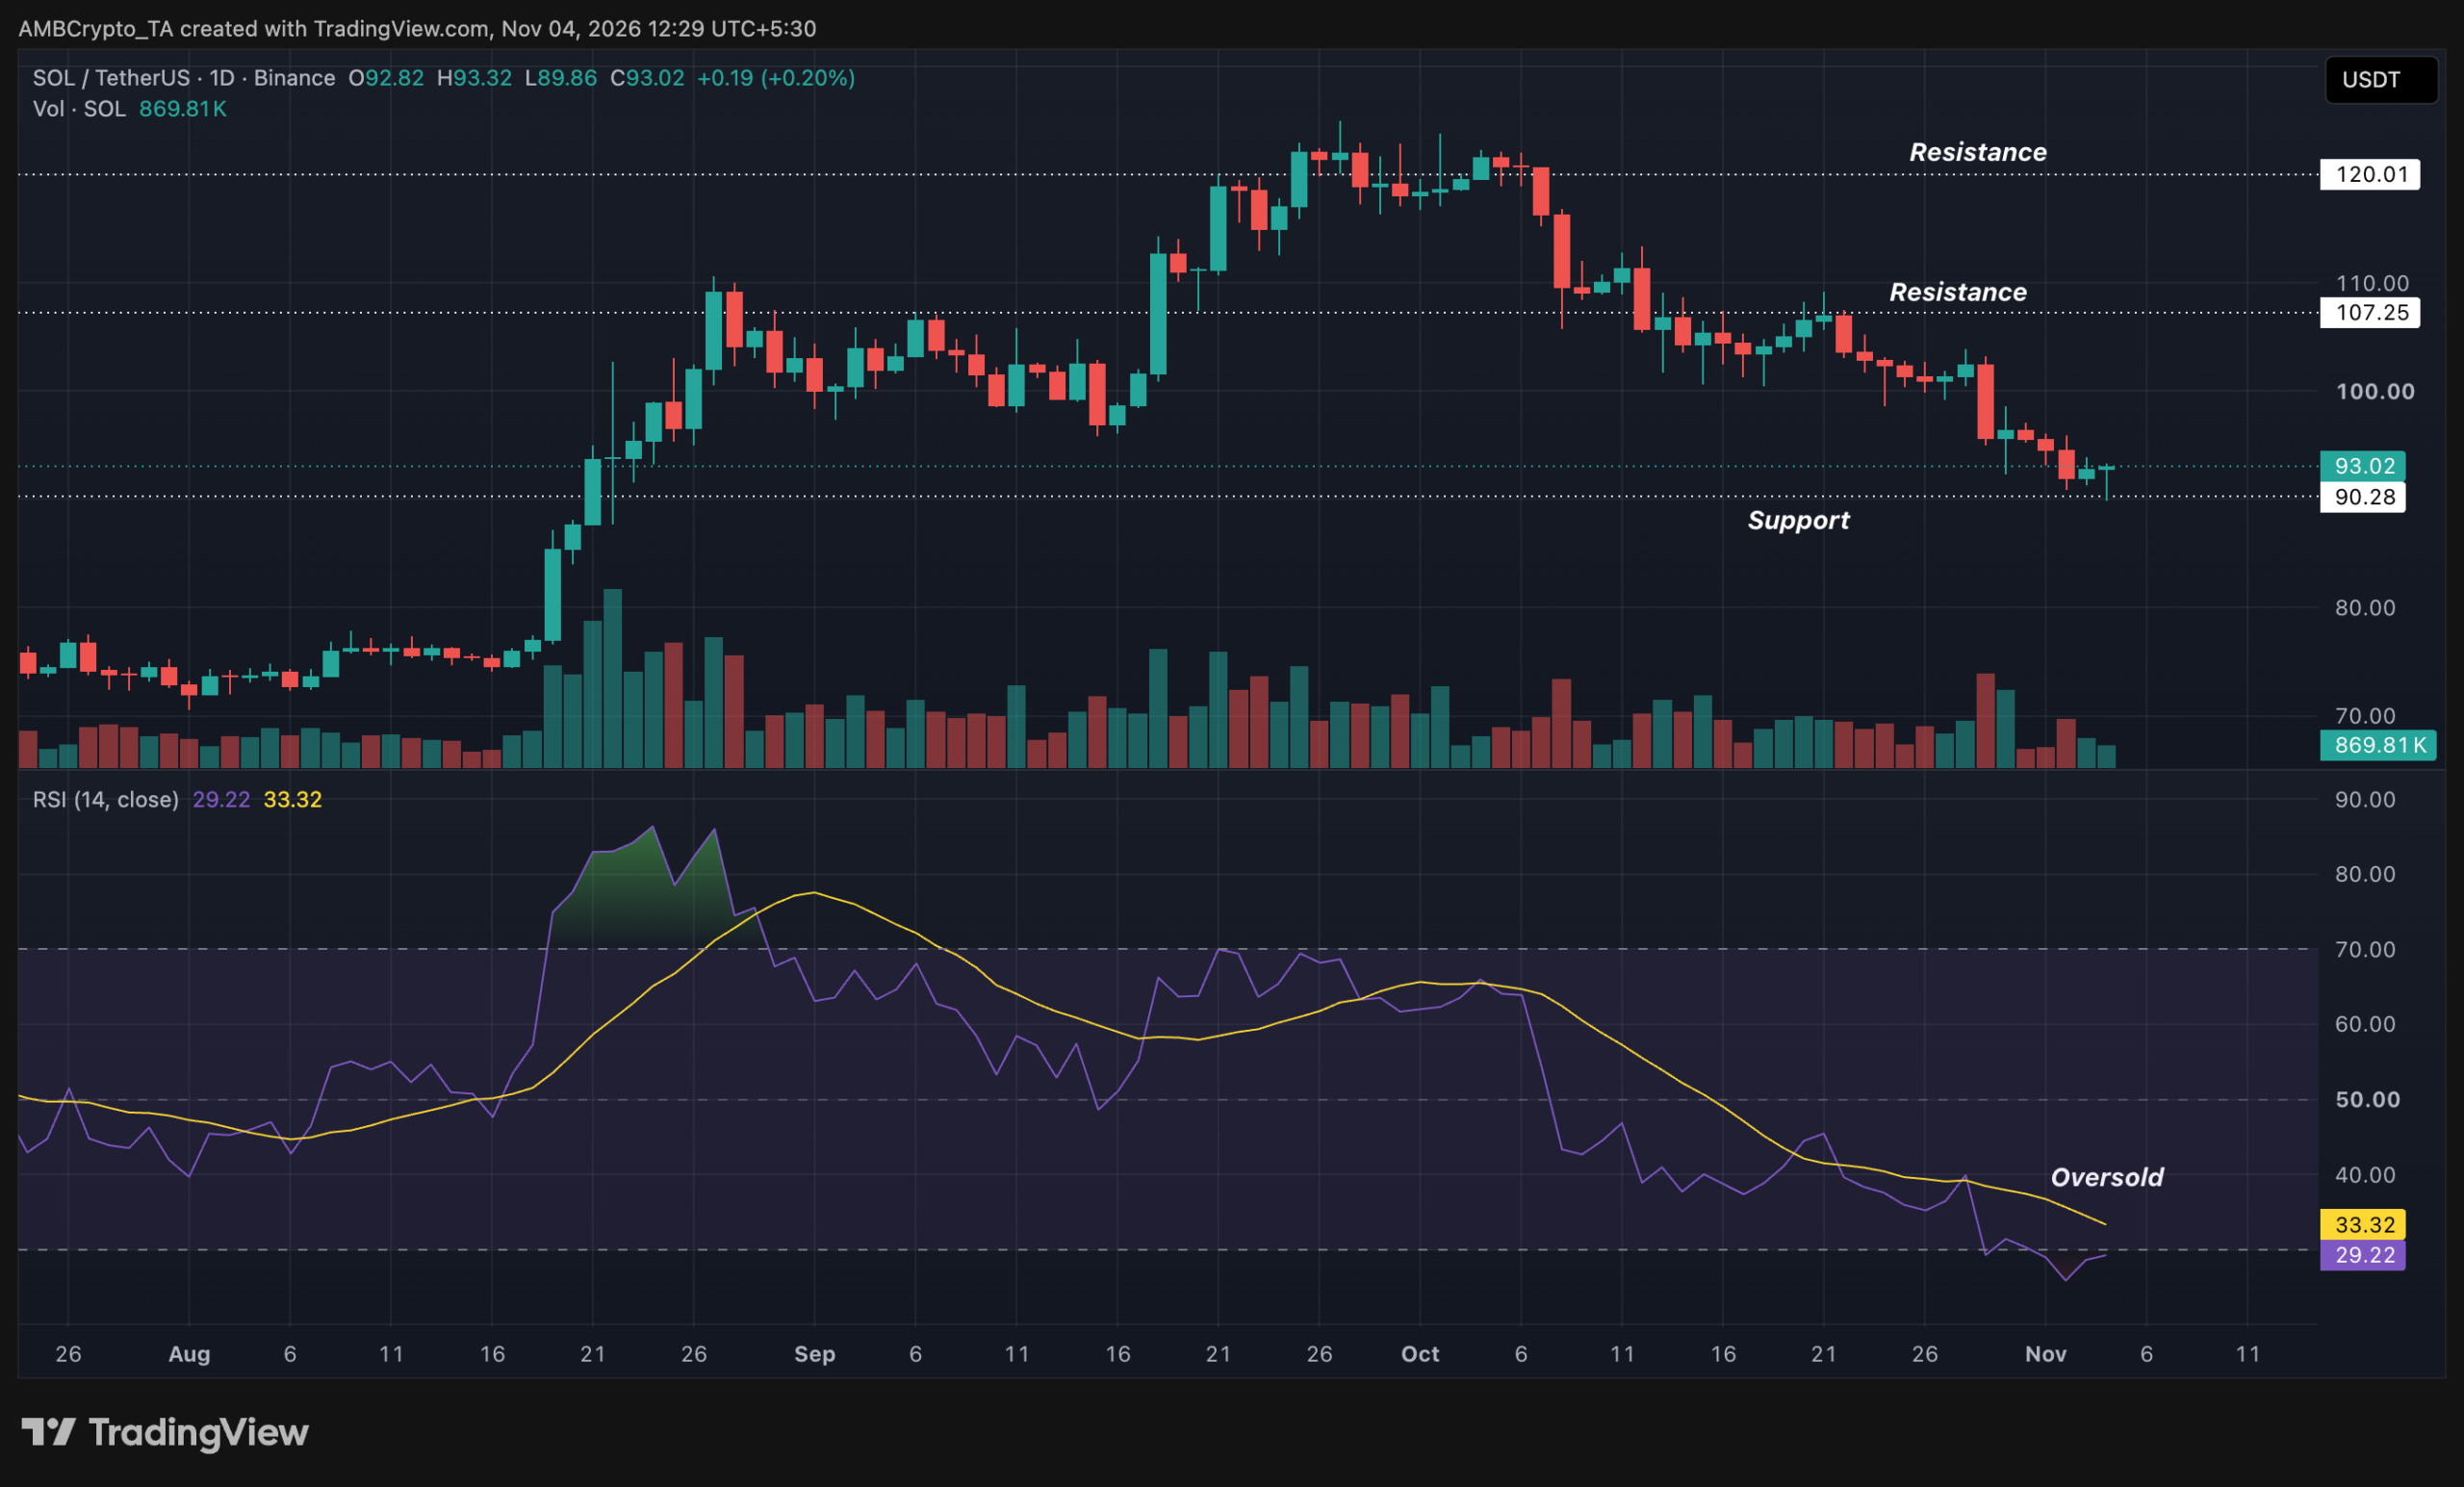
However, past patterns have always suggested that the overold or overbought zone always calls for a pullback. And as for this theory, the pattern is somewhat being reflected given the past 24 hours’ price hikes.
Echoing similar sentiments, an analyst on X also highlighted how the decline has pushed SOL below both its 50-day EMA at $103.20 and its 200-day EMA at $99.88, indicating that bearish momentum is strengthening.
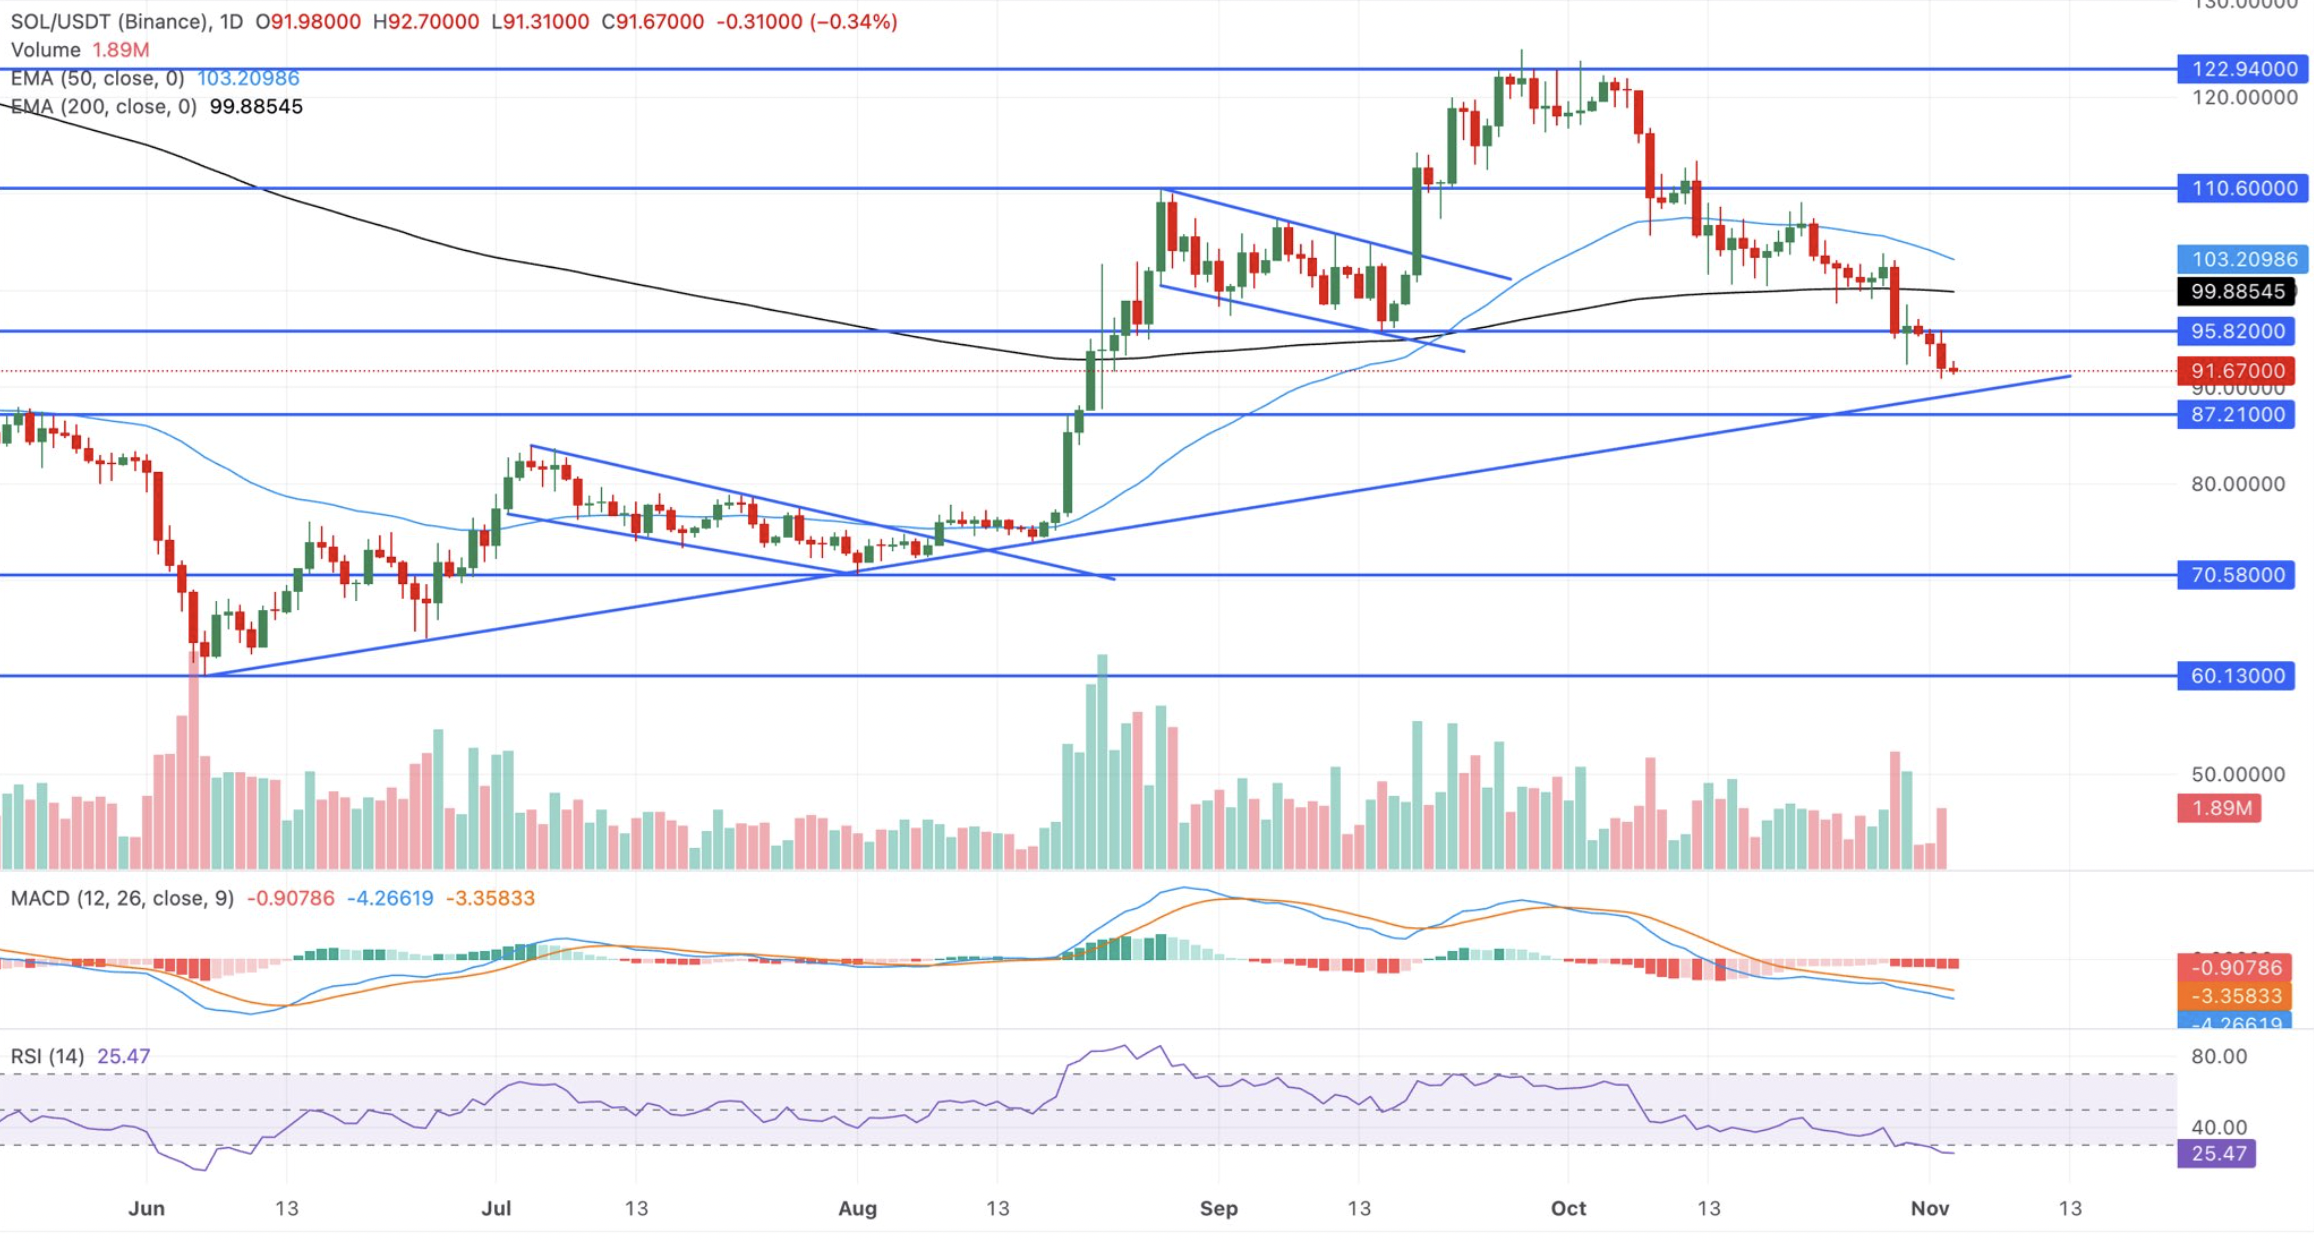
Needless to say, the cryptocurrency is now testing an upward-sloping trendline, with immediate support around $89.27. So, if SOL fails to hold this level, the price could decline further towards the next support levels of $87.21 and $70.58.
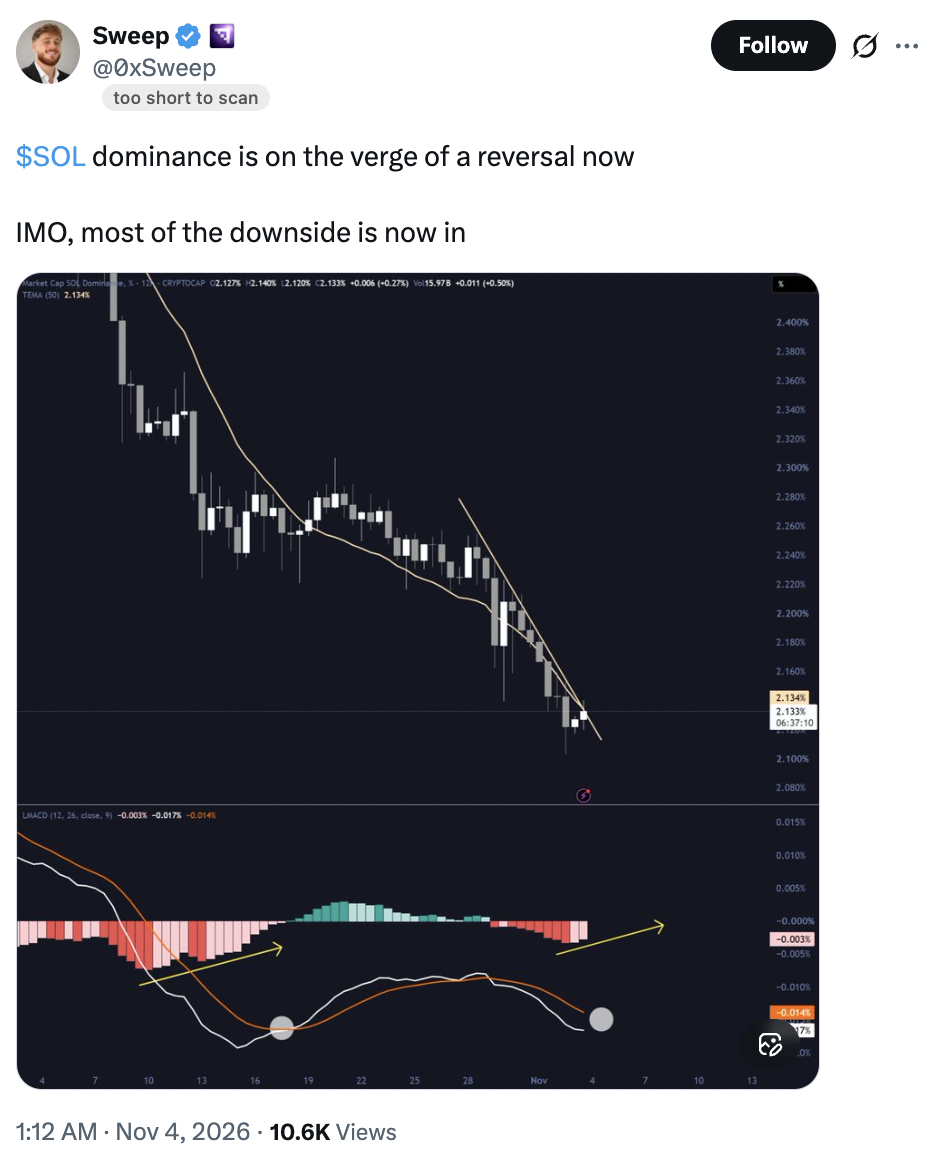
However, another analyst believes that most of SOL’s downside may already be behind it, suggesting that the token could be approaching a potential reversal.
What’s behind this seller dominance?
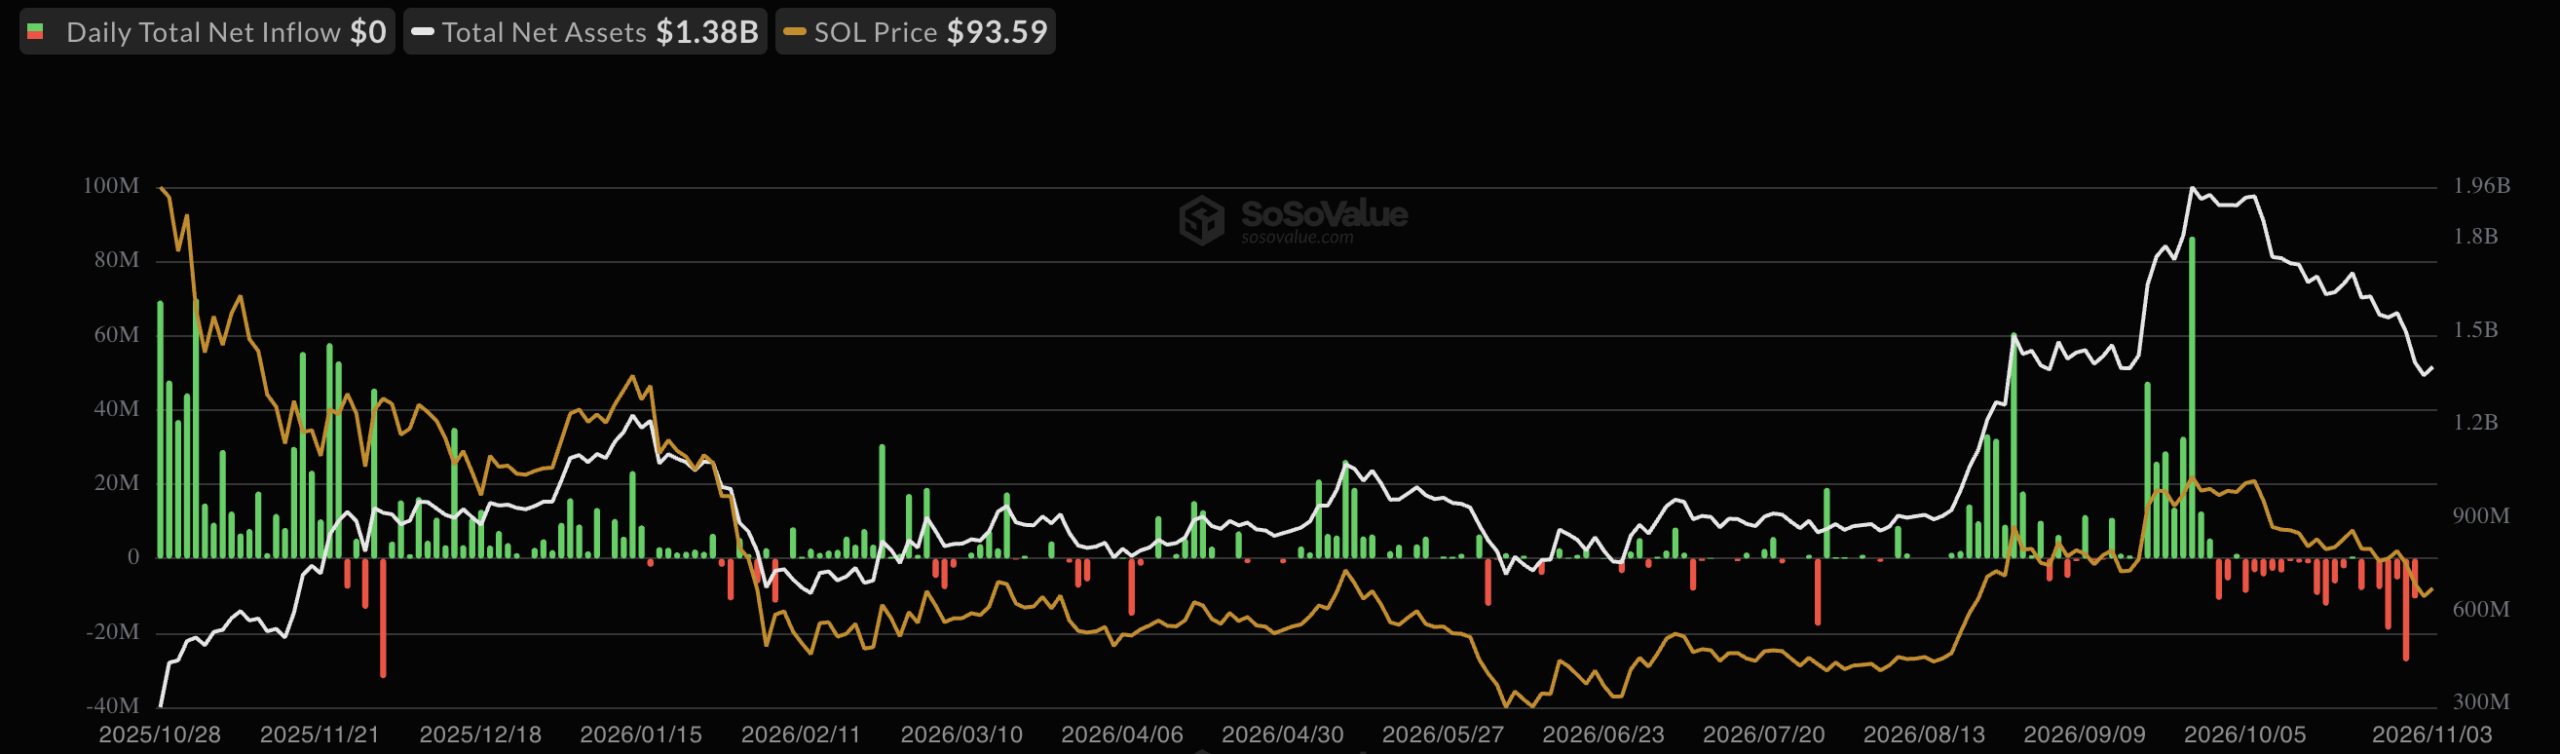
Now coming to the factors, this downward pressure might be because of multiple reasons, the first being its ETFs’ weekly outflows.
According to SoSo Value data, these ETFs saw the biggest weekly withdrawal ever in the week ending October 30, with net outflows of about $71.47 million.
Following this, there were outflows of $17.30 million the week ending October 23, $25.52 million the week closing October 16, and $24.81 million the week finishing on October 9.
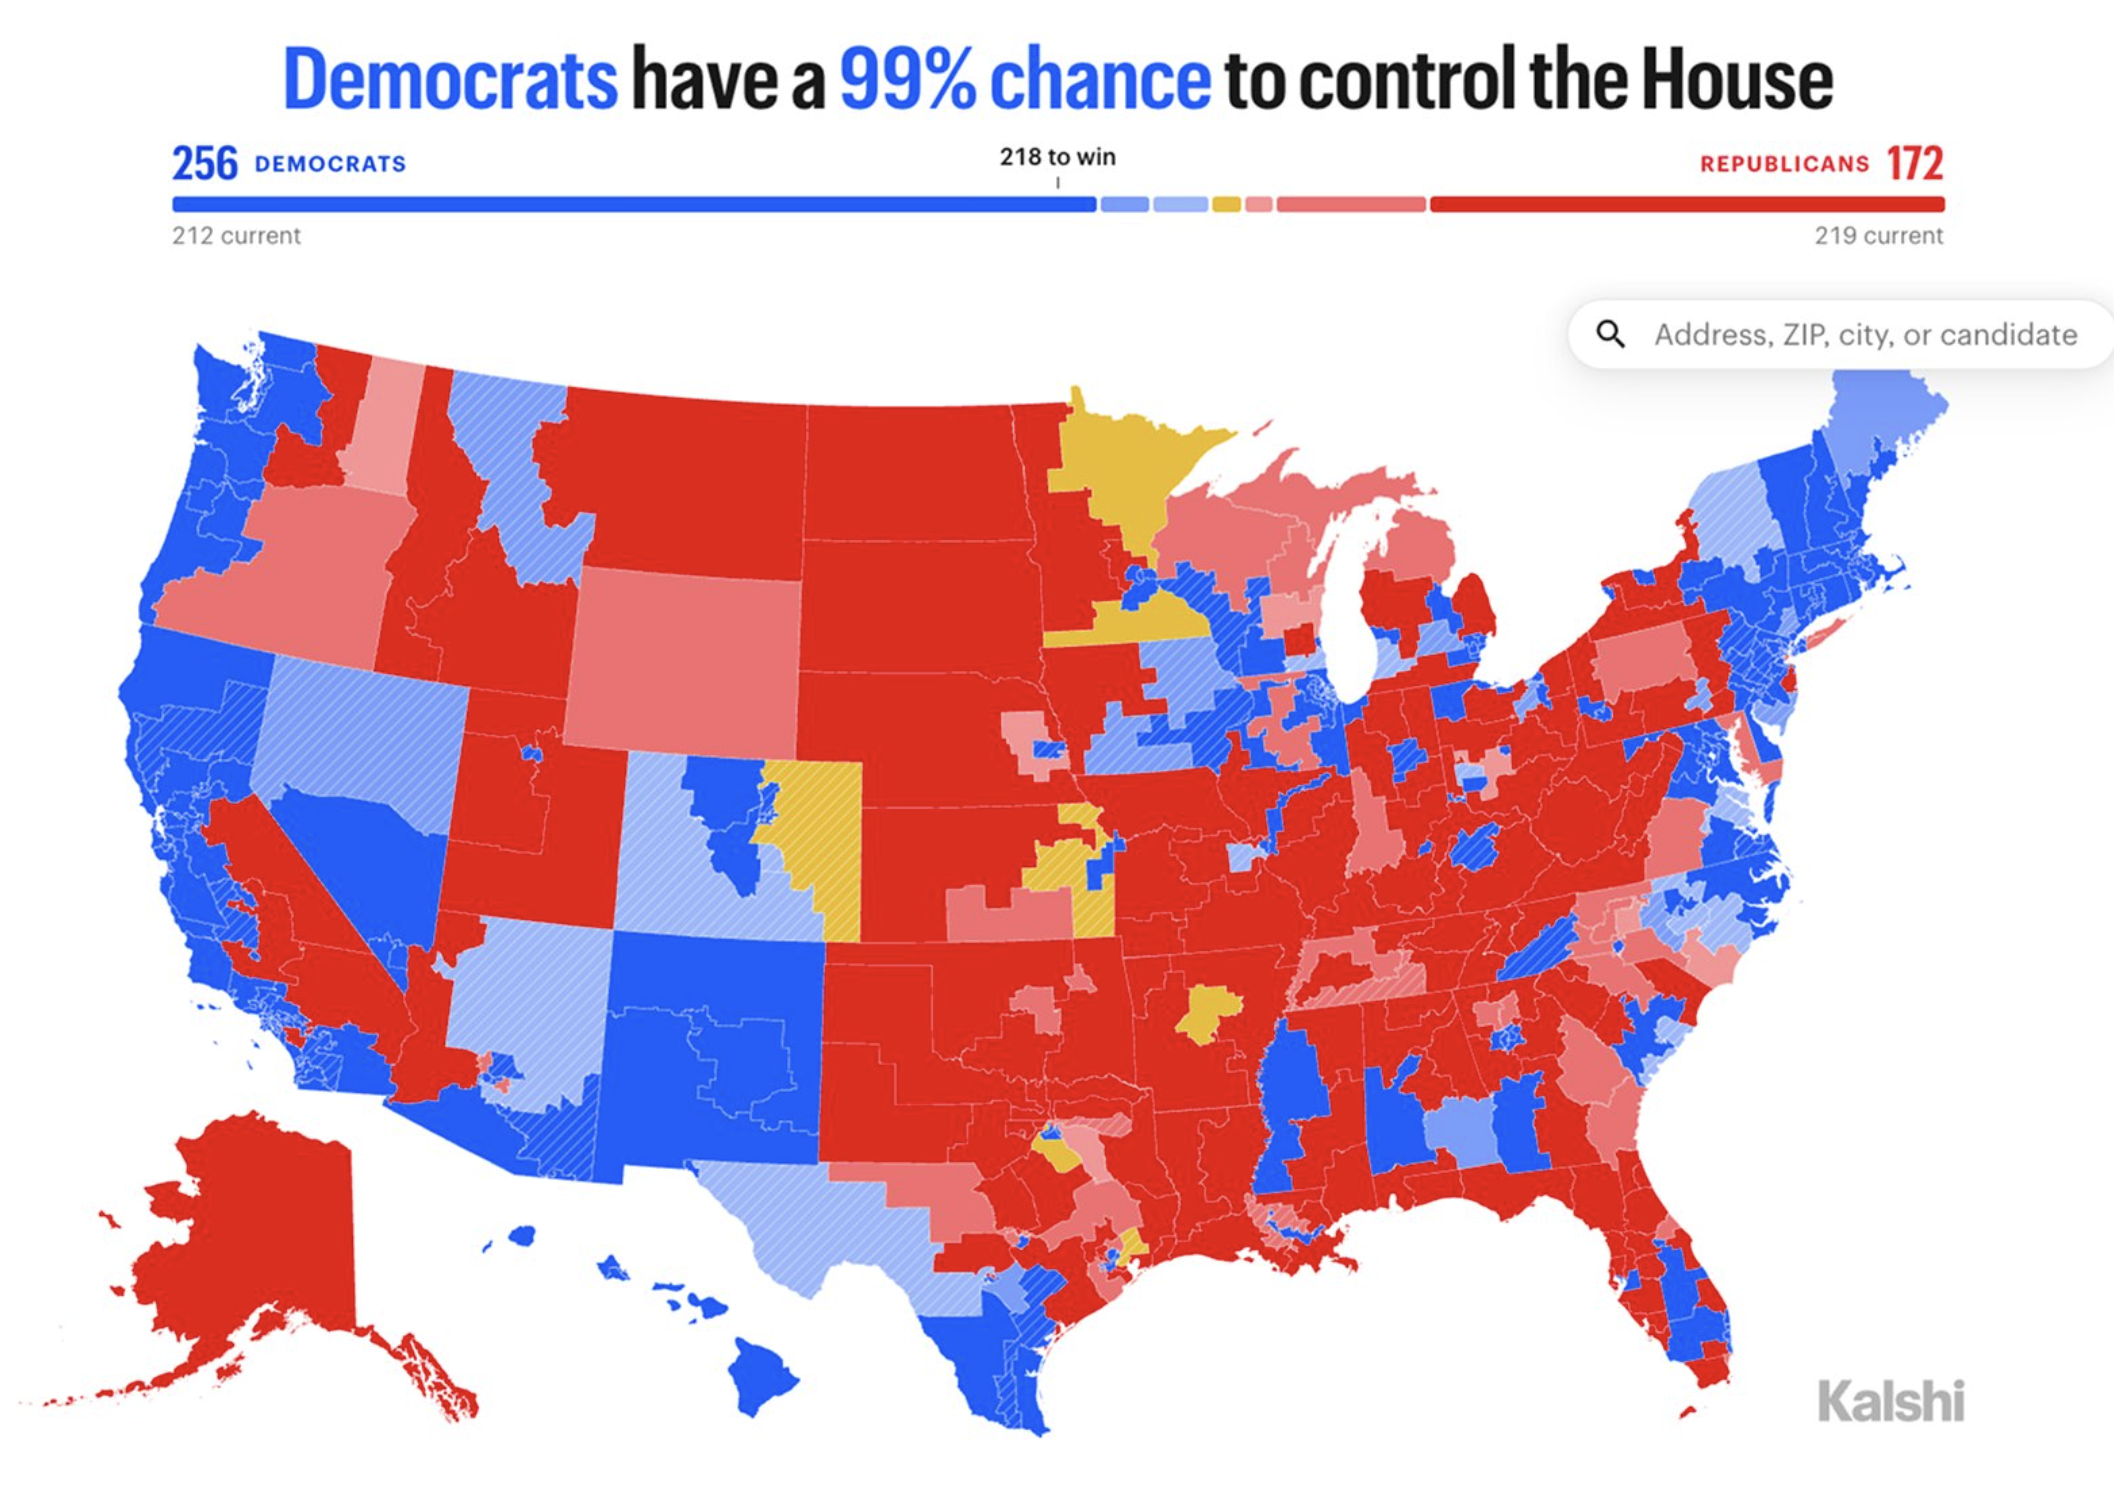
At the same time, the U.S. midterm elections added more fuel to the fire with a 99% Democratic sweep rate on predictions markets.
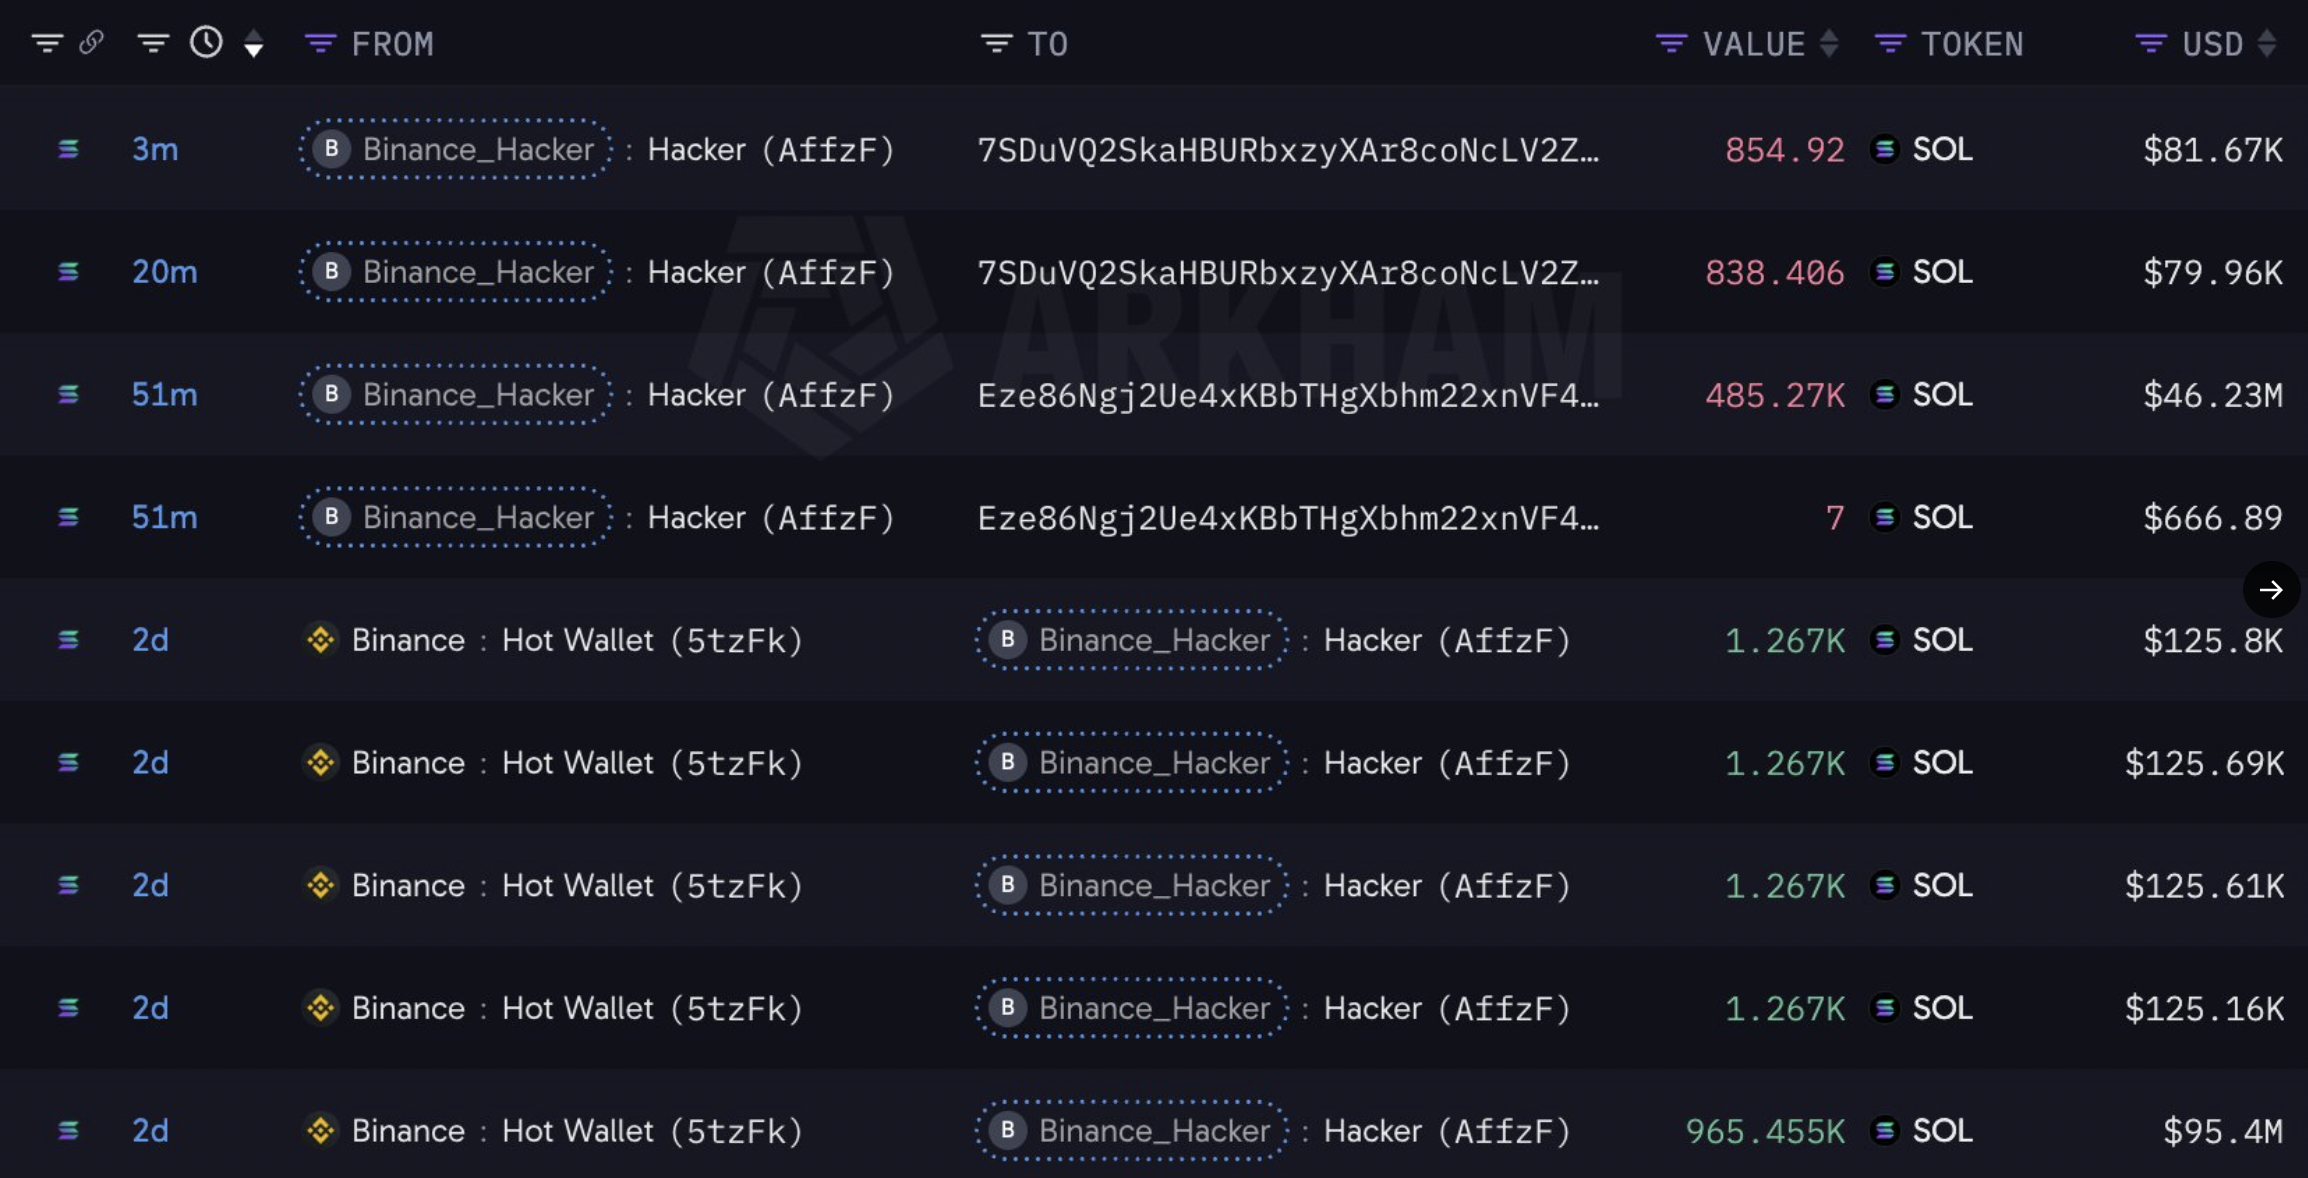
Meanwhile, the wallets linked to the Binance hack have reportedly started moving nearly $96 million worth of stolen SOL into Bitcoin conversion routes. All of this explains why Solana’s price has fallen into bearish hands.
On-chain metrics favor sellers, but…
Further validating the arguments, the Solana Spot Taker CVD (Cumulative Volume Delta) chart suggests that SOL has recently turned red, signalling taker sell dominance.
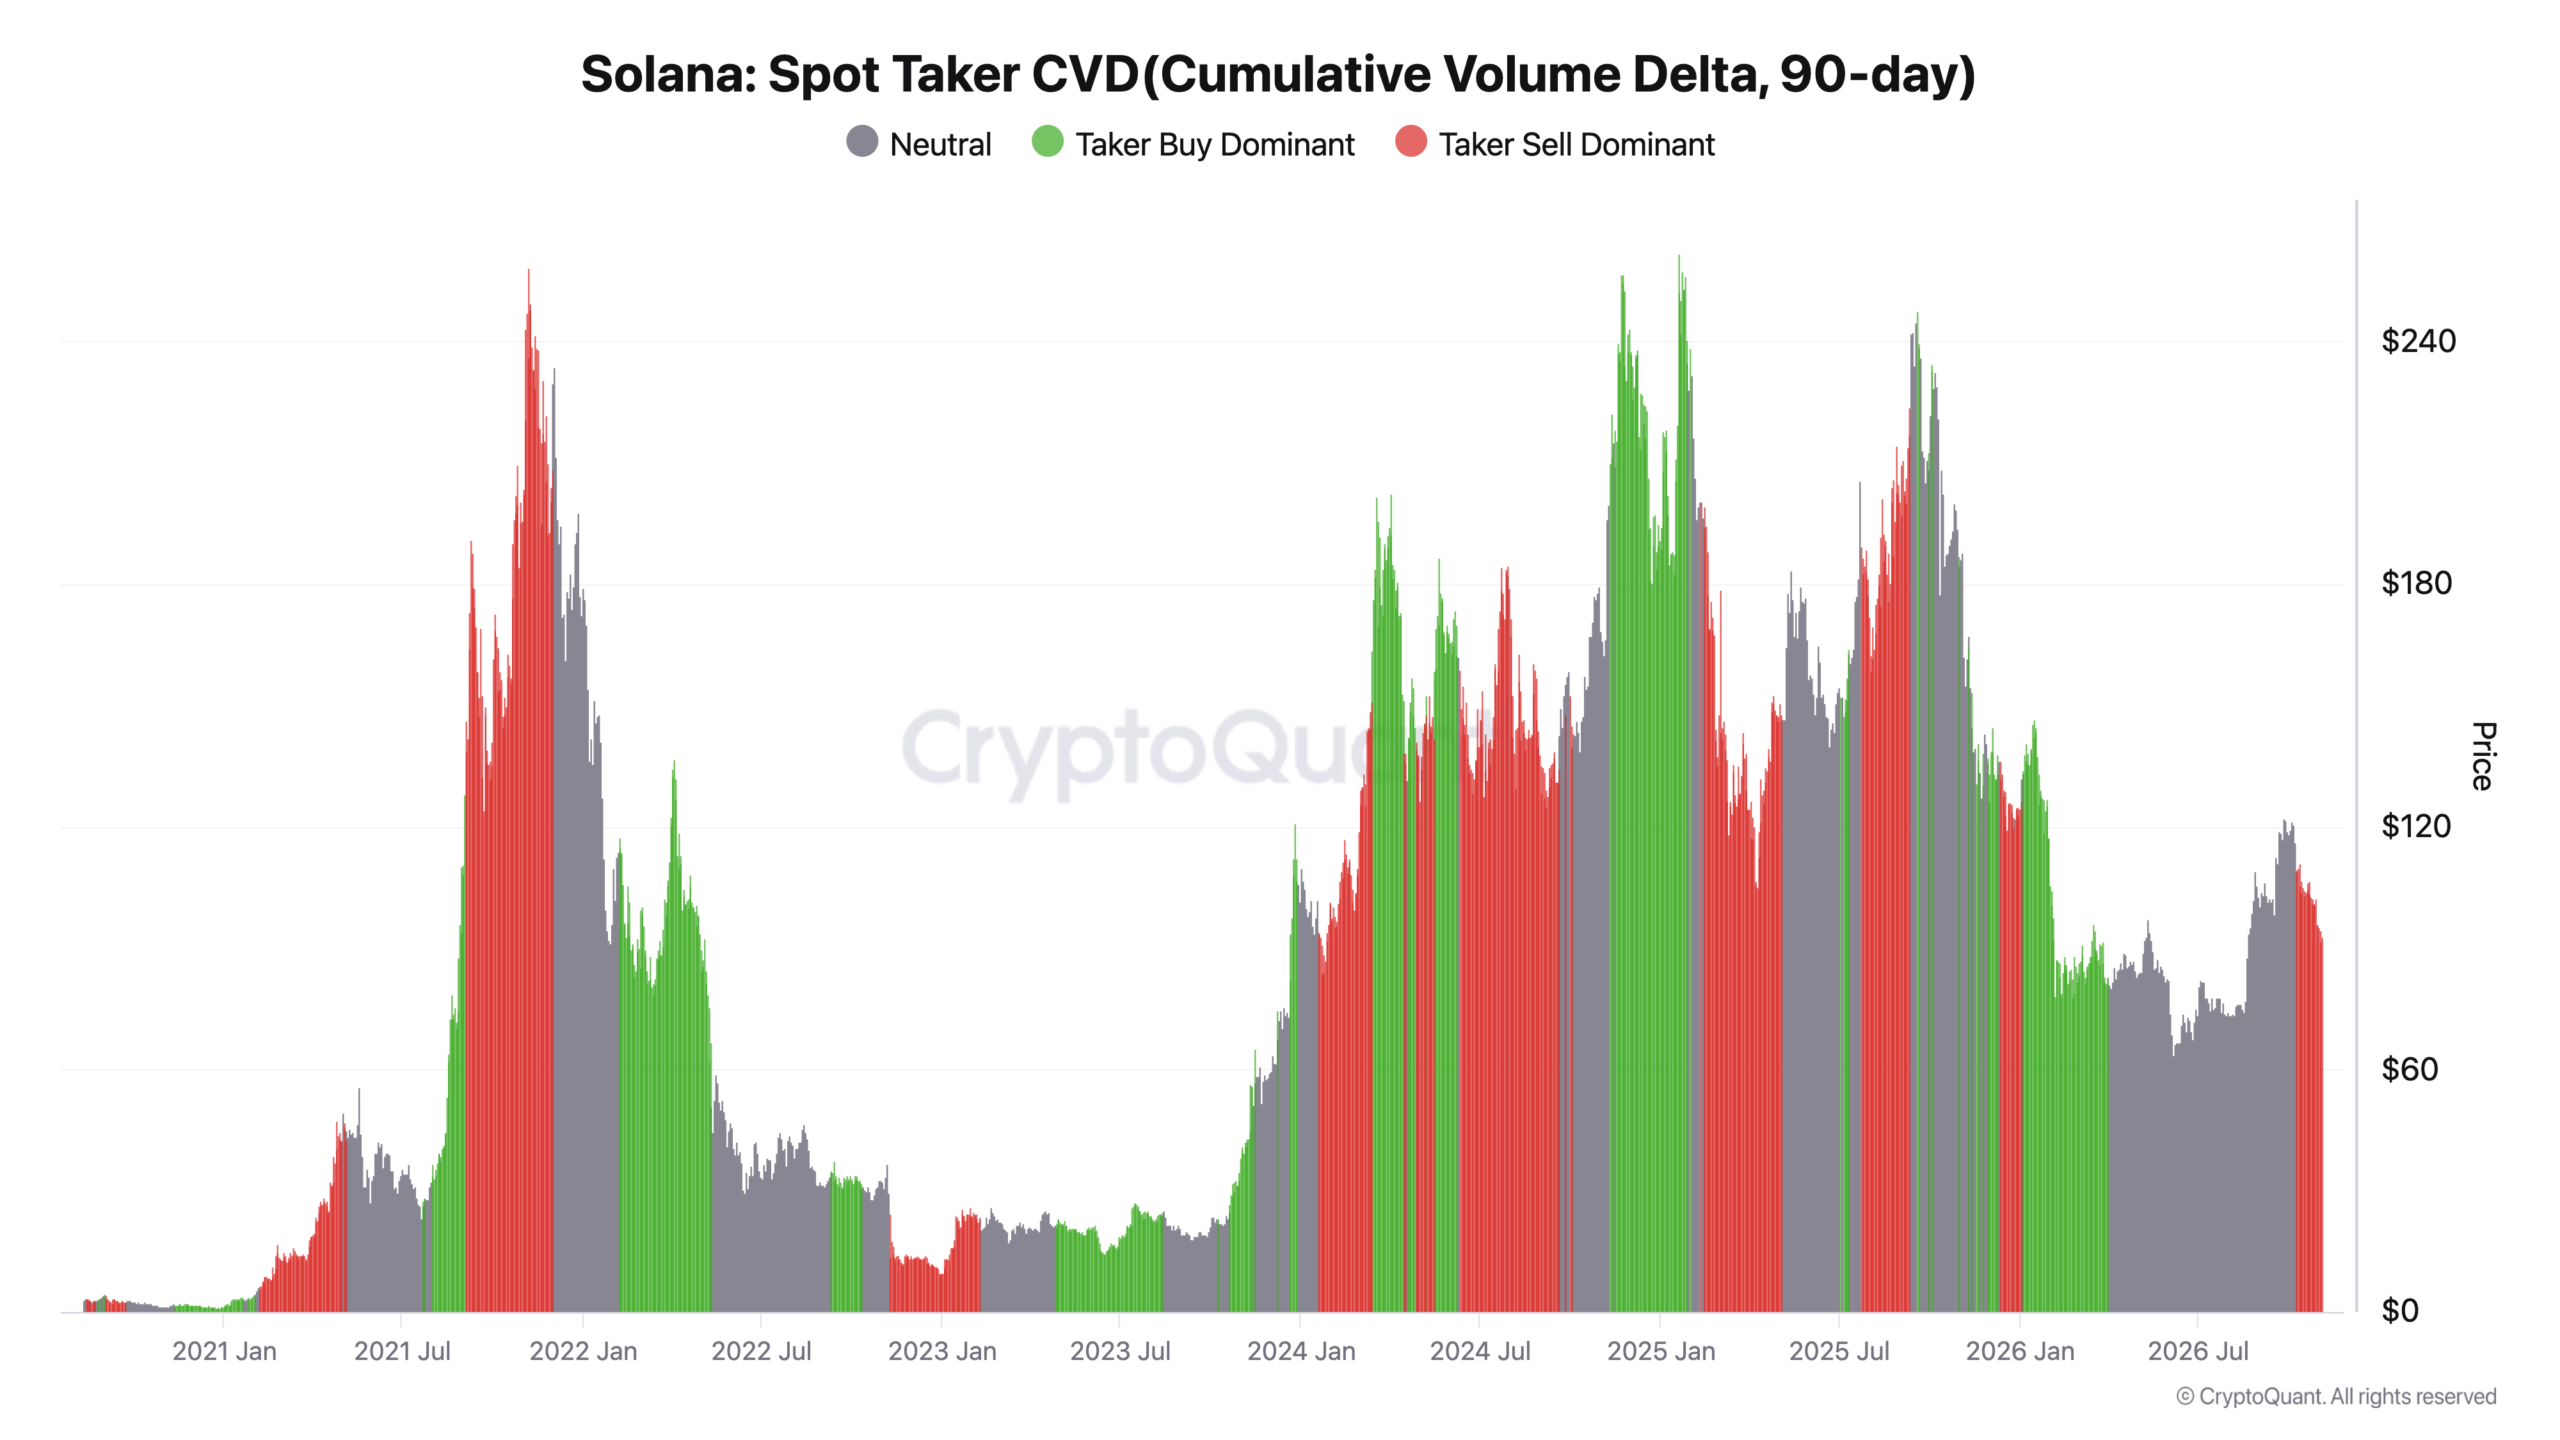
This means aggressive market sellers are outweighing buyers, suggesting that investors are increasingly willing to sell SOL at available market prices rather than accumulate it.
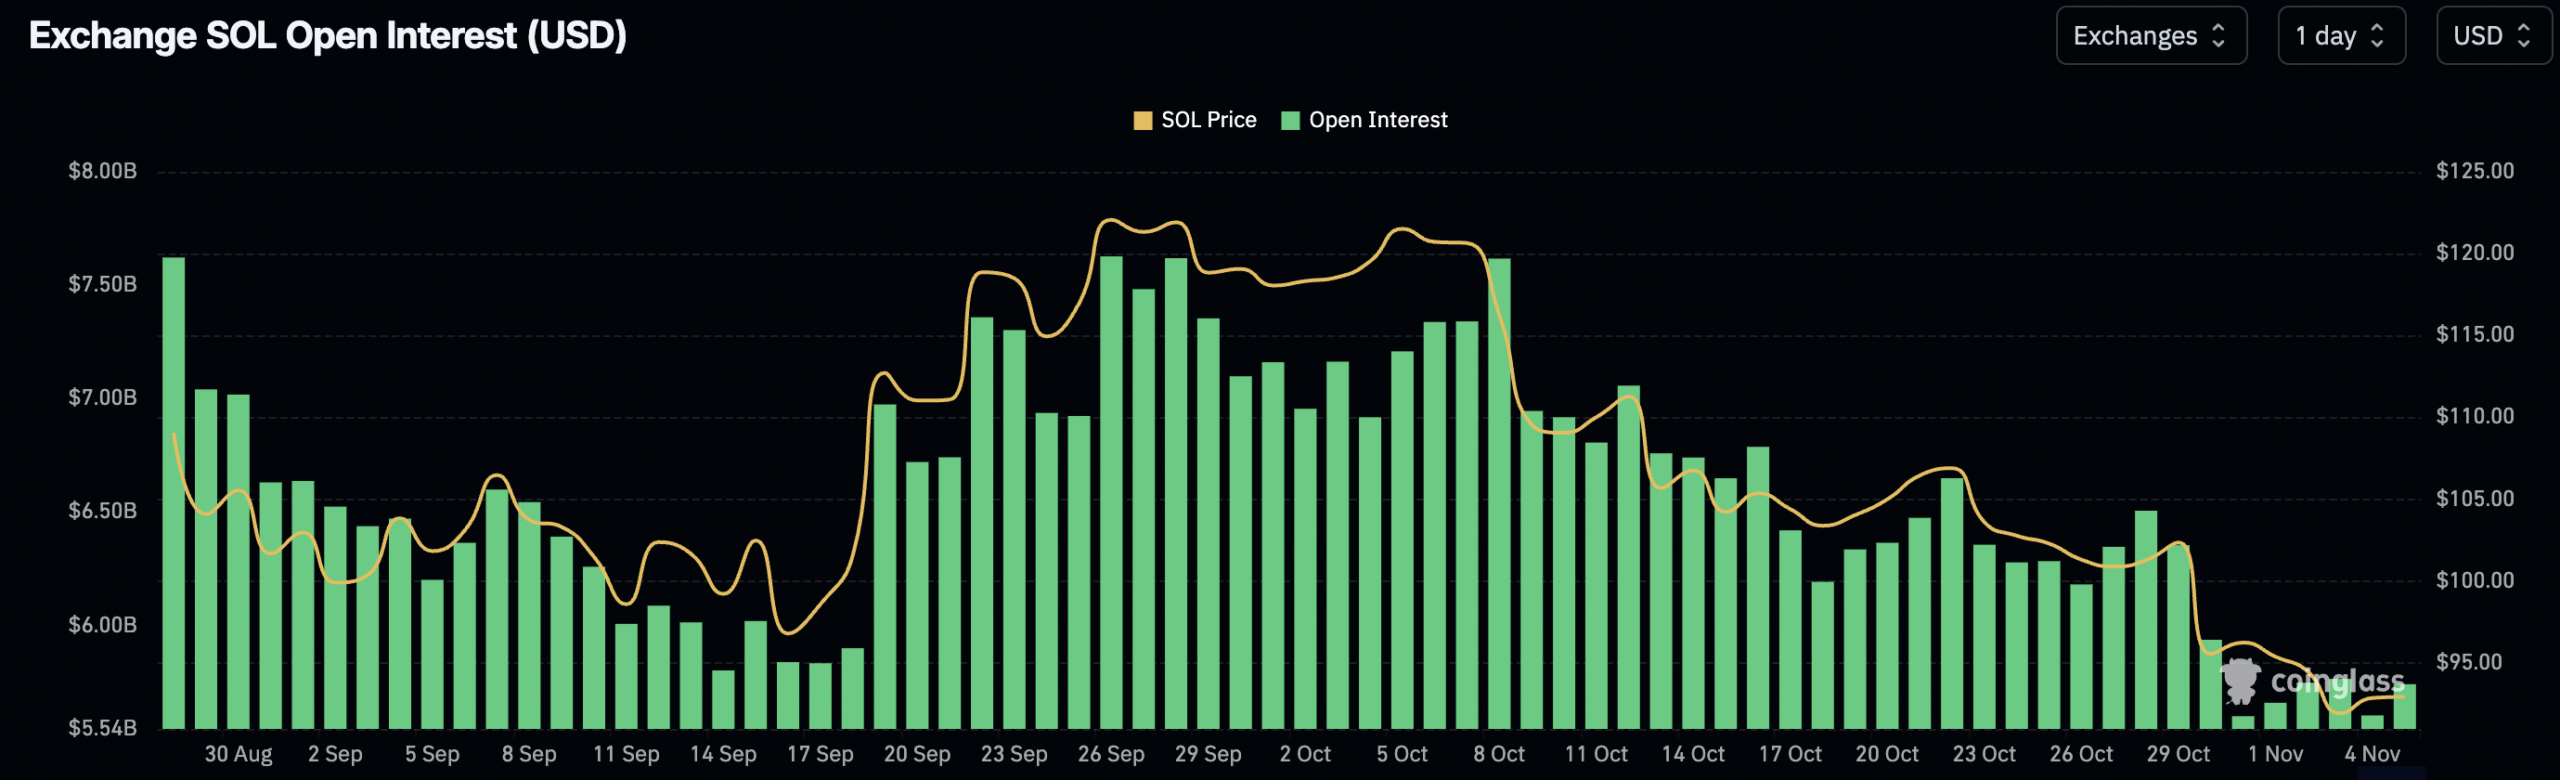
Additional Solana’s Open Interest has also declined sharply towards the end of October and into November, falling from around $6.5 billion on October 29 to approximately $5.7 billion by November 4.
However, with Solana seeing growing real-world stablecoin adoption, with monthly card spending reaching a record $141 million on 31st October, a sevenfold increase from October 2025.
And, Solana’s stablecoin holder addresses increasing from fewer than four million in October 2024 to 14 million by October 2026, hope remains
Final Summary
- The RSI of Solana has fallen in the overbought zone.
- Solana ETFs, the U.S. midterm election, and the Binance hack added more weight to the uncertainty.