Solana’s [SOL] recovery hits snag at $24 – pullback retest likely?
Solana [SOL] hit a blockage, forcing bulls to scamper for safety. A pullback retest on the $20 support is likely if sellers gain more leverage.
![Solana’s [SOL] recovery hits snag at $24 - pullback retest likely?](https://ambcrypto.com/wp-content/uploads/2023/05/image-1200x900-16.png)
Disclaimer: The information presented does not constitute financial, investment, trading, or other types of advice and is solely the writer’s opinion.
- The structure was neutral on the daily chart at press time.
- About $1.2 million worth of long positions liquidated in the past 24 hours.
Solana [SOL] witnessed price fluctuations in April, and May wasn’t on a good start either. On 9 April, SOL inflicted a rally, appreciating by 30% from $20 to $26.
Is your portfolio green? Check SOL Profit Calculator
But the price rejection at the $26 resistance level led to retracement, clearing all the gains. Bulls’ attempts at recovery were thwarted at press time, as SOL witnessed downward pressure that could set it to retest the support level of $20.
Meanwhile, crypto markets could witness elevated volatility in the first week of May due to the FOMC meeting on 2-3 May. As such, macro traders should track key SOL levels during this period.
Sellers are keen to sink SOL below 50-EMA
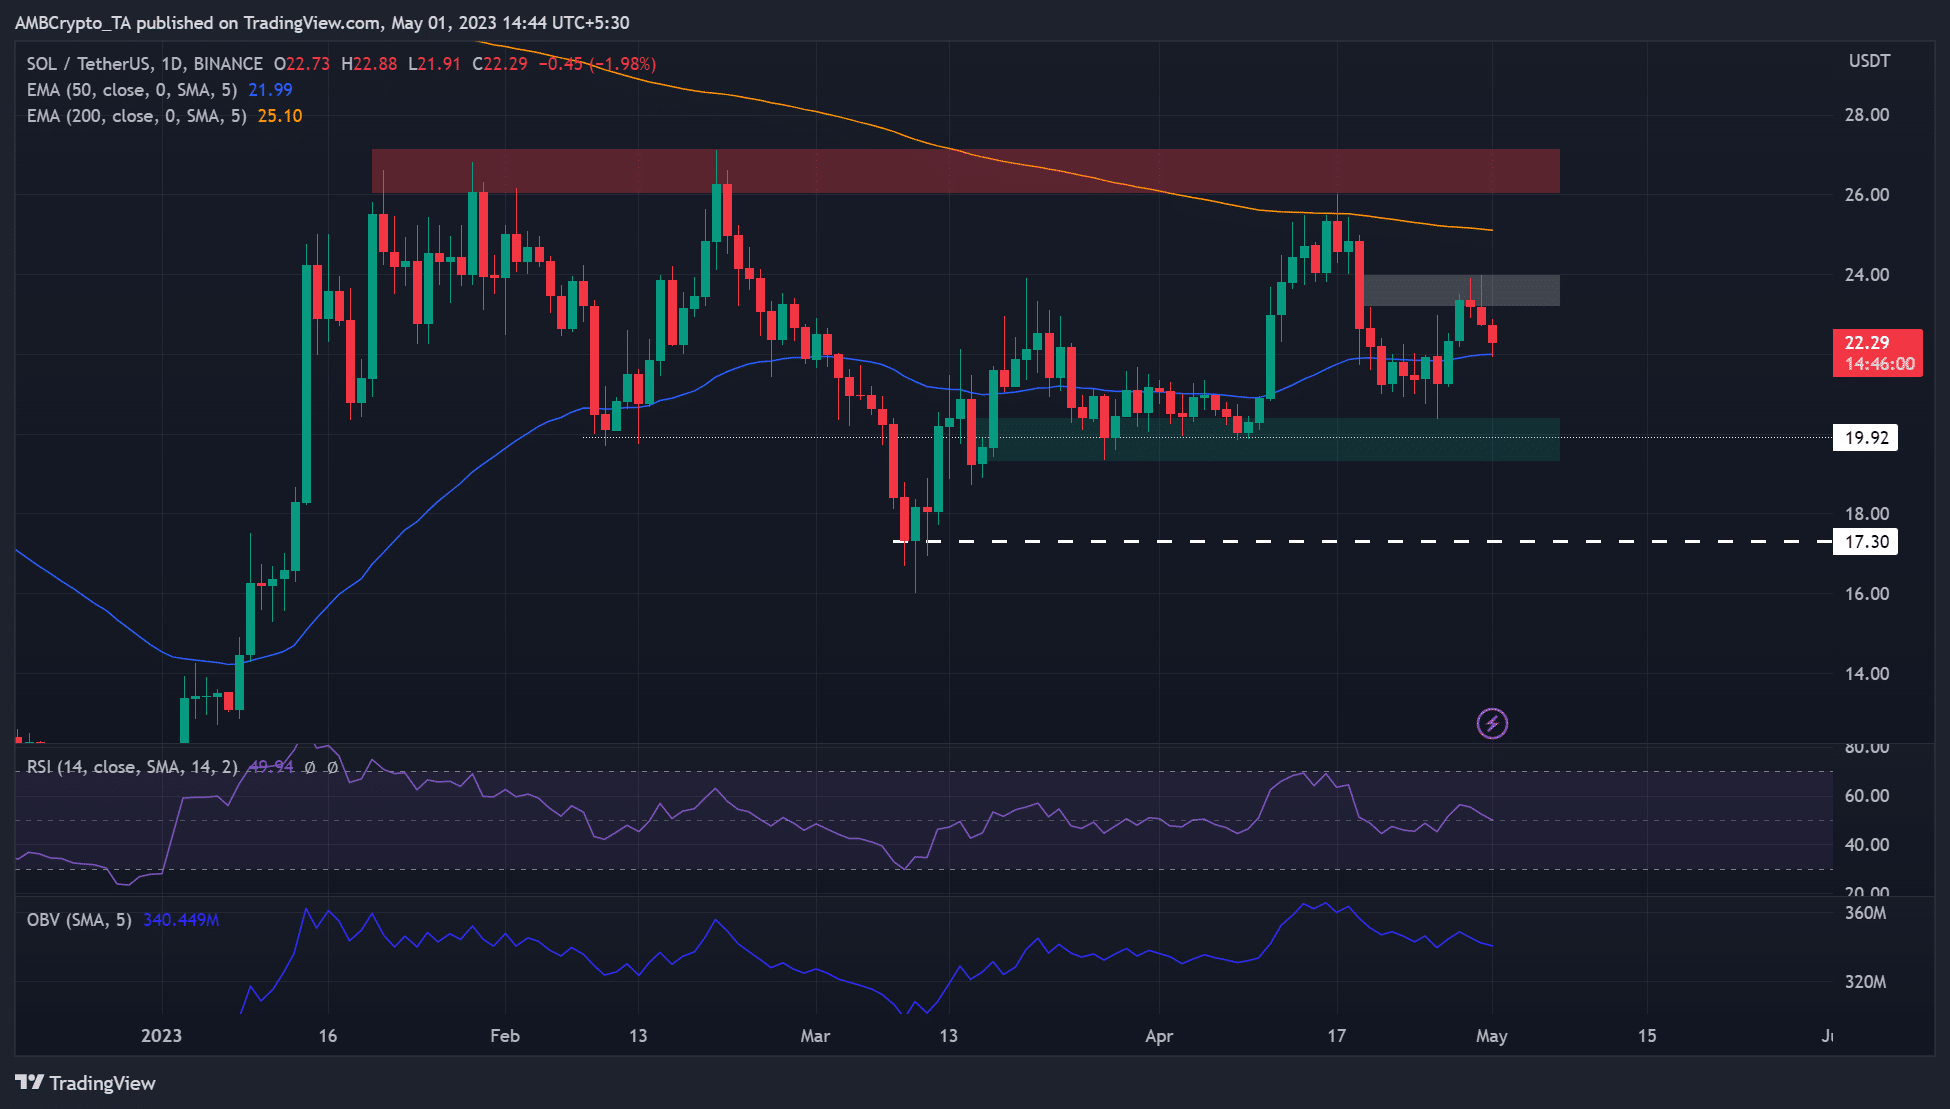
Price action oscillated between $20 and $23.9 in late March. But in April, price action fluctuated between $20 and $26. Notably, the $19.92 is a key bullish order block on the daily chart that has prevented further drops since late March.
The recovery inflicted in late April hit an FVG (fair value gap) of $23.19 -$23.98 (white), stalling bulls’ efforts. At press time, sellers were keen on pushing SOL below the 50-EMA ($21.99) (blue line).
If sellers clear the hurdle, SOL could drop to the support around $20 and attempt another recovery. If the $20 support cracks, the SOL/USDT pair could drop to $17.30.
On the other hand, a close above the FVG zone could offer bulls the needed leverage to target the price ceiling of $26. However, they must also deal with the obstacle at 200-EMA (25.10). However, a retest of the price ceiling at $26 could attract more sellers.
At the time of writing, the RSI (Relative Strength Index) was at 49.94, a neutral position, which means price action can go in either direction. However, the OBV (On Balance Volume) has declined since mid-April and could offer sellers a leg up.
More long positions wrecked
How much are 1,10,100 SOLs worth today?
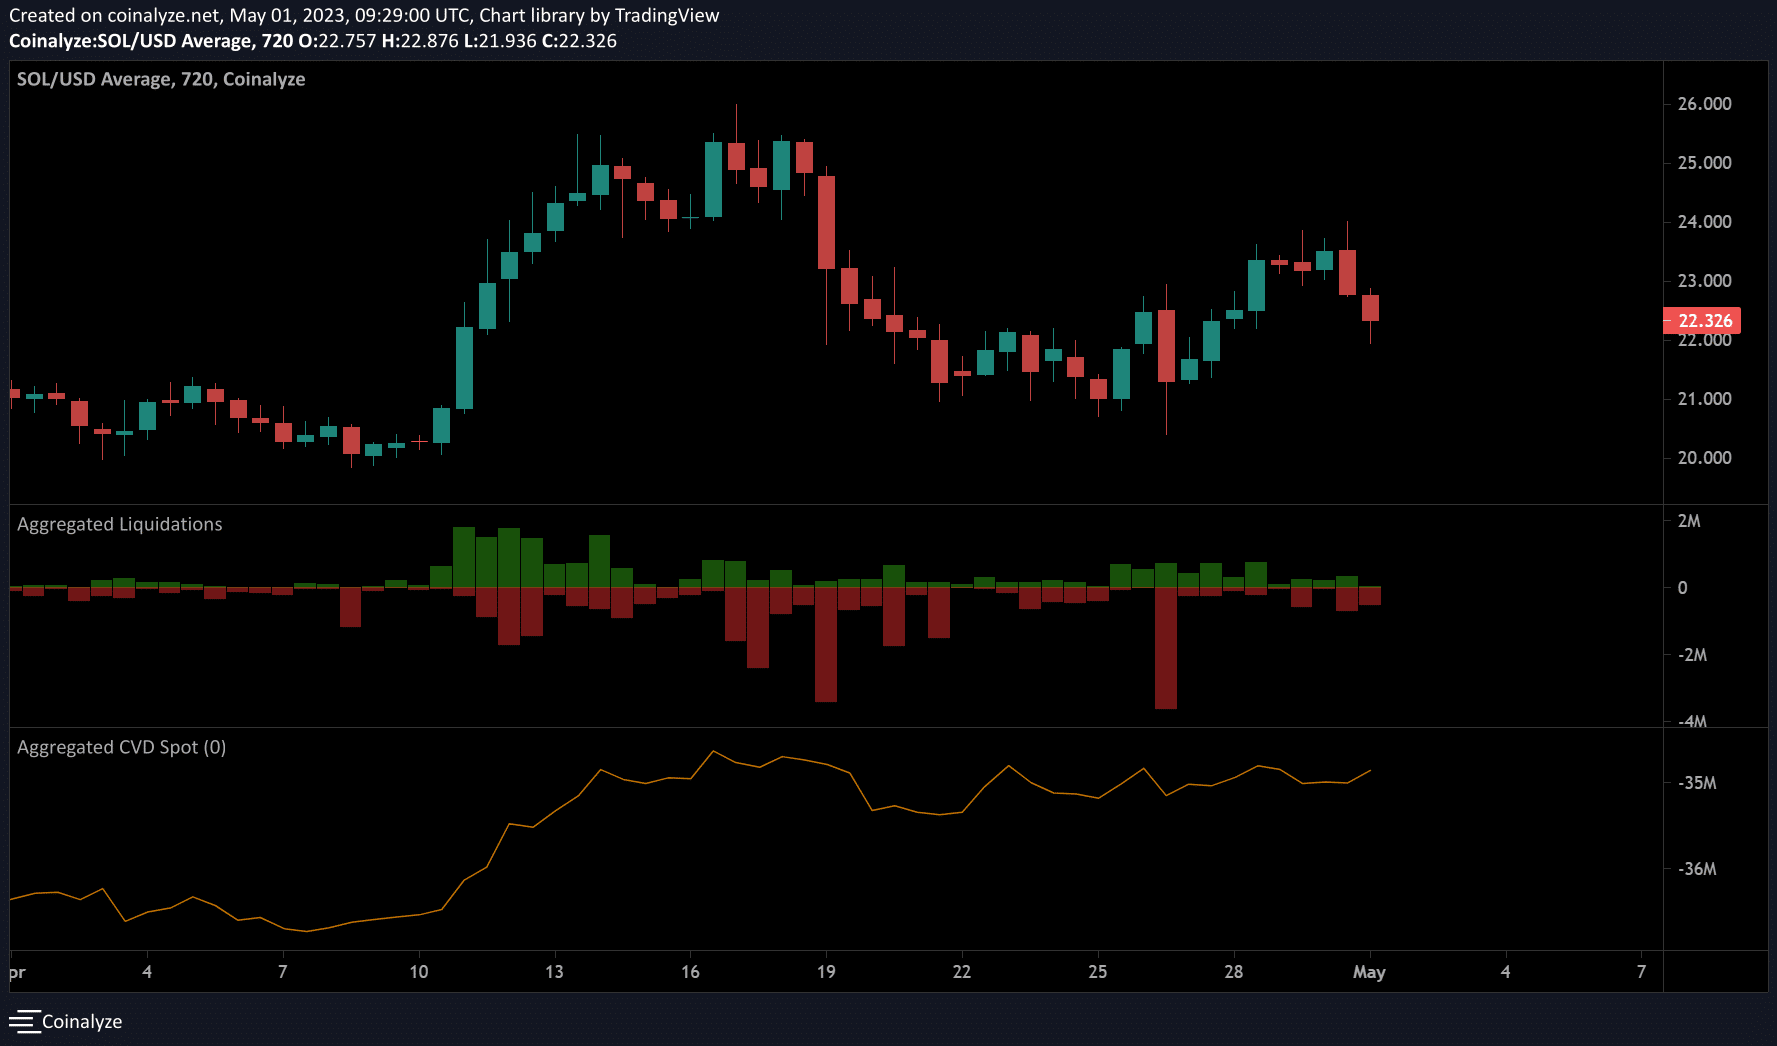
According to Coinalyze, $1.2 million worth of long positions were wrecked in the past 24 hours. In the same period, only $373k worth of short positions were liquidated – reinforcing the underlying bearish sentiment at press time. The trend could tip bears to sink SOL to $20 or lower.
However, the aggregated CVD (cumulative volume delta) spot rose slightly, indicating bulls were fighting for control. A bullish Bitcoin [BTC] could boost bulls’ efforts, thus it is worth tracking these fronts before making moves.