Stablecoins see reduced activity amidst market uncertainty: What now?
The Tether dominance shows that participants prefer holding stablecoins, due to fears of market volatility.
- The stablecoins activity has taken a hit in recent weeks.
- The dominance chart reflected reluctance from market participants to buy assets.
Bitcoin [BTC] was under pressure in the lower timeframes from the bears. The halving and the subsequent retracement might be ending, and the summer could shape up to be a long consolidation phase.
This meant that the altcoin market also saw a bearish performance for the most part.
Sectors like memes have been the outliers, but overall the trend has been bearish over the past month.
AMBCrypto analyzed stablecoin behavior to understand market participants’ sentiment — are they willing to take risks yet?
User activity has fallen over the past month
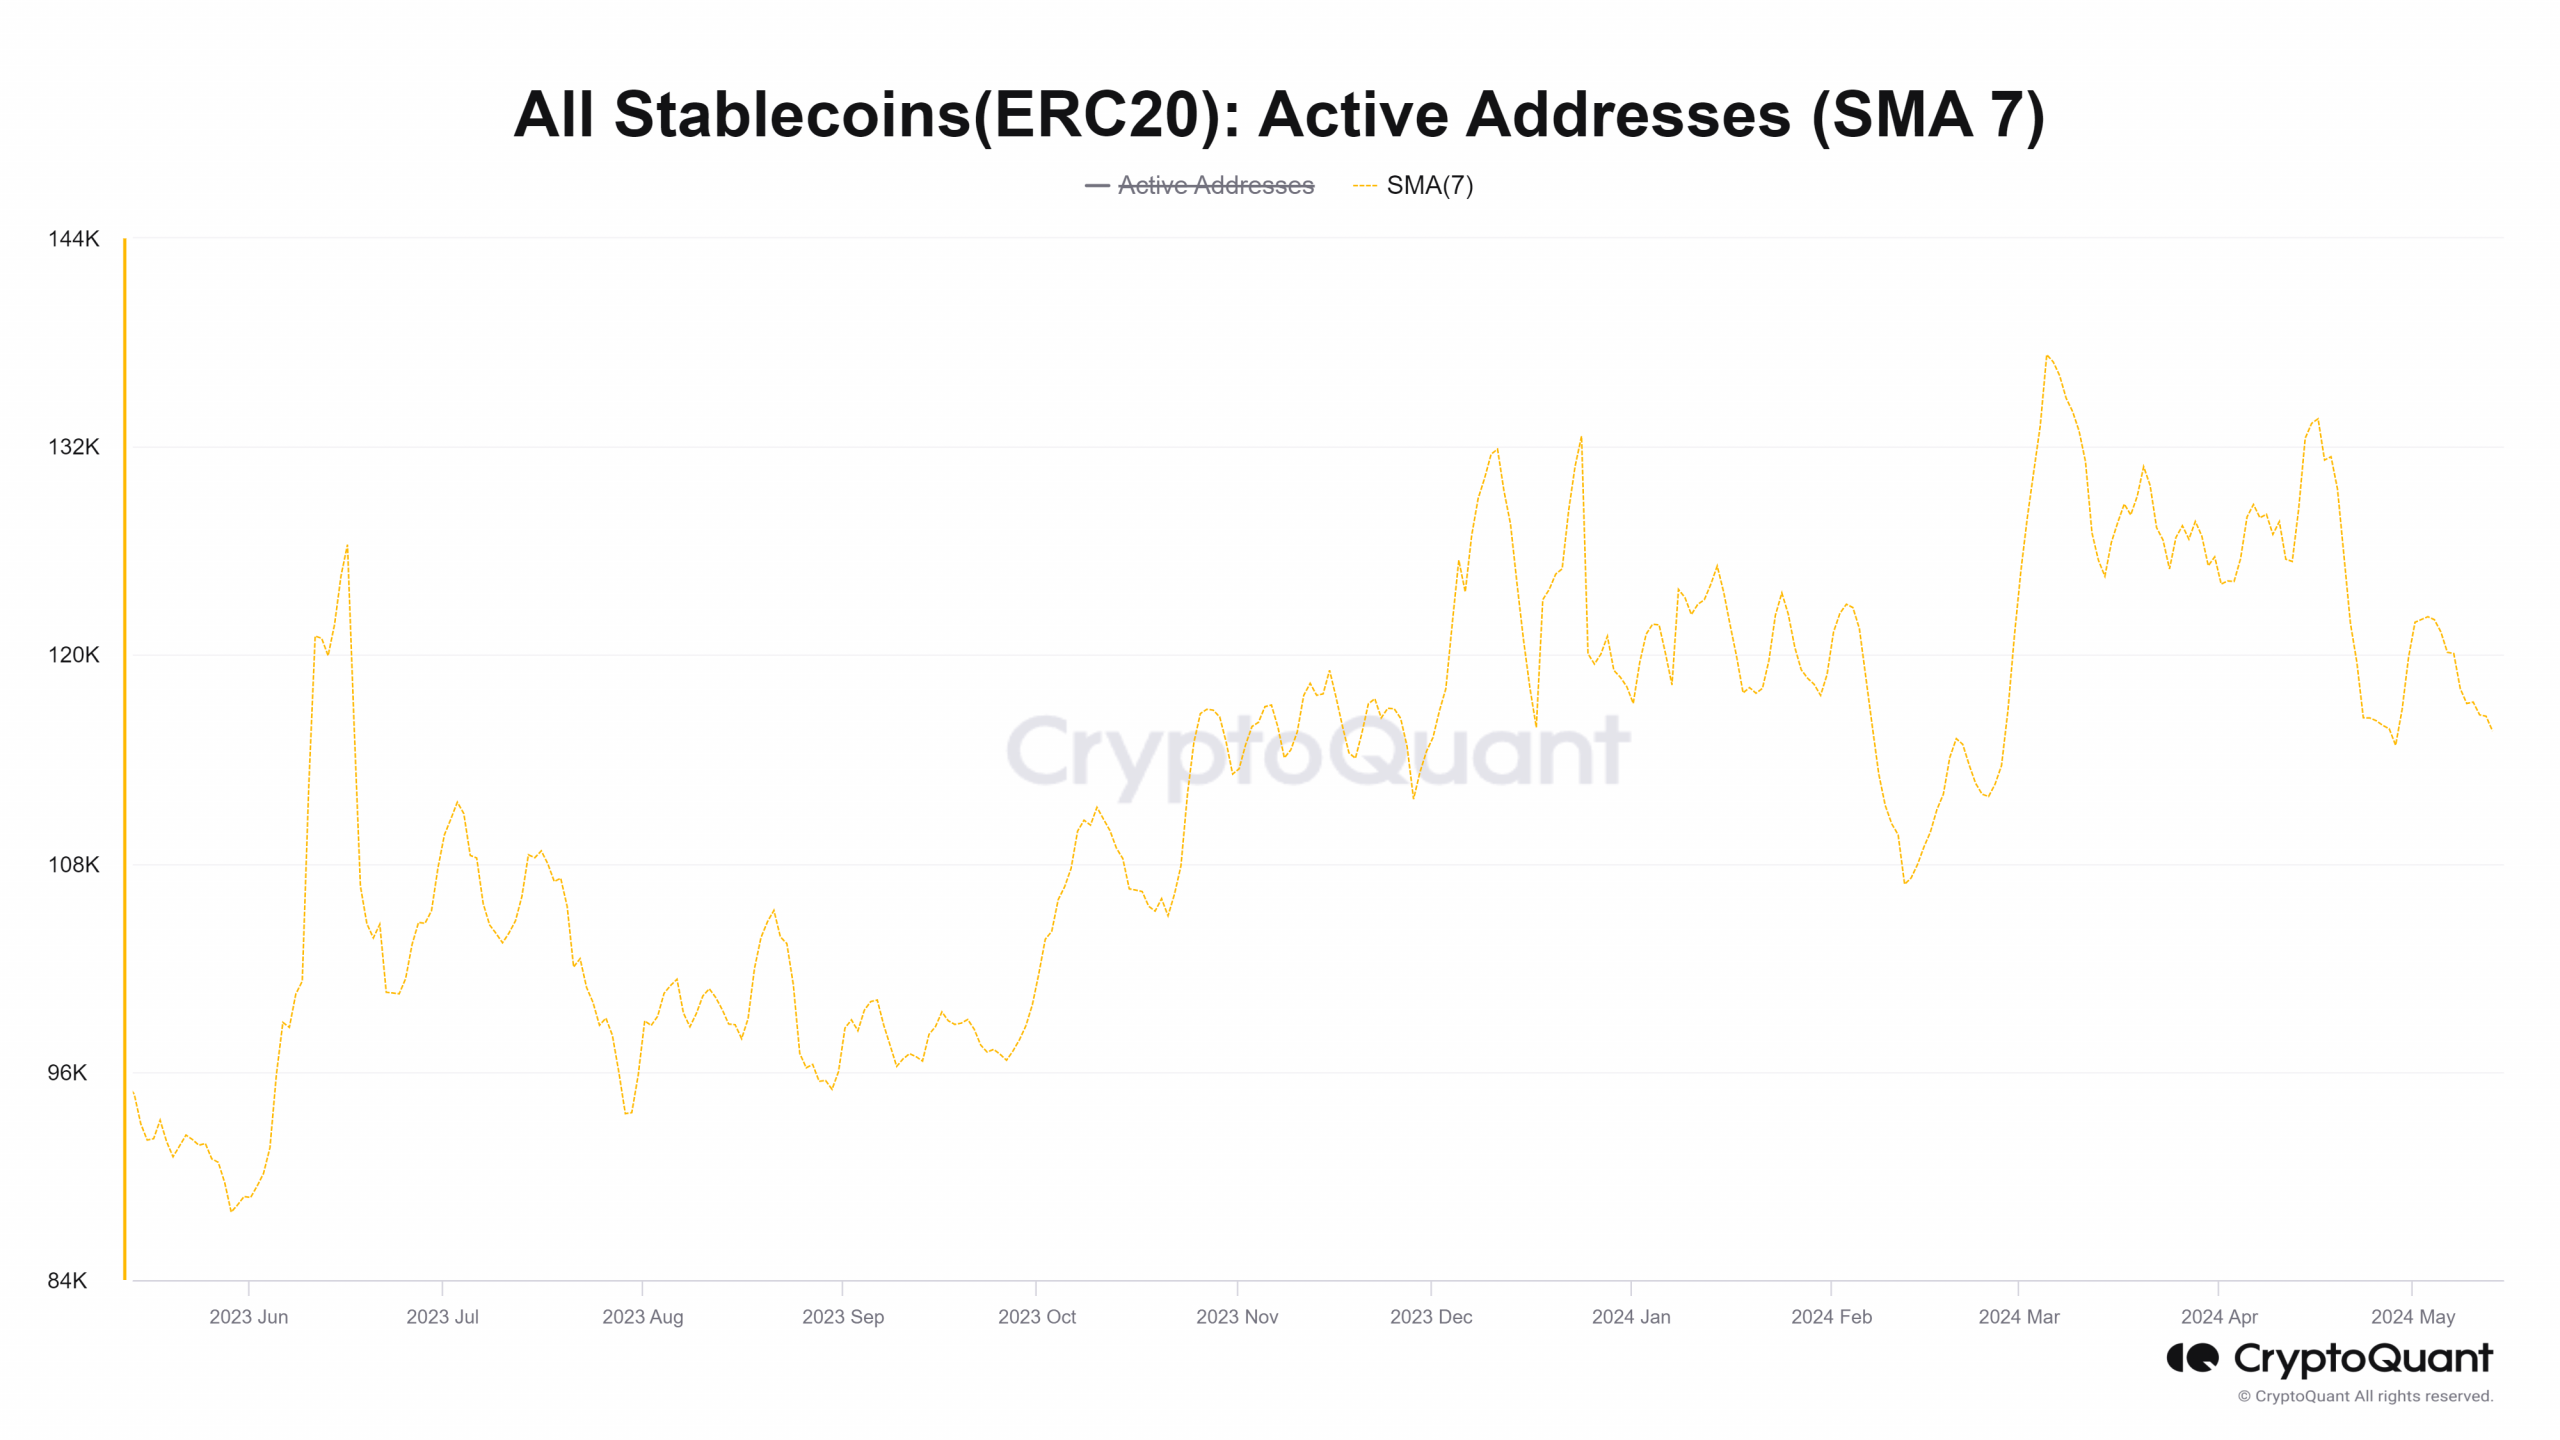
AMBCrypto analyzed data from CryptoQuant to assess stablecoin usage. The active addresses metric chart above tracks the total number of unique active addresses, both sender and receiver.
Its 7-day simple moving average has trended downward since the 16th of April.
It had trended higher in February and peaked in early March when the market made strong gains. Just a few days after this peak, Bitcoin managed to push past the $70k barrier.
Its downtrend in recent days suggested reduced interaction and buying and selling activity, which hinted that participants were not bullish.
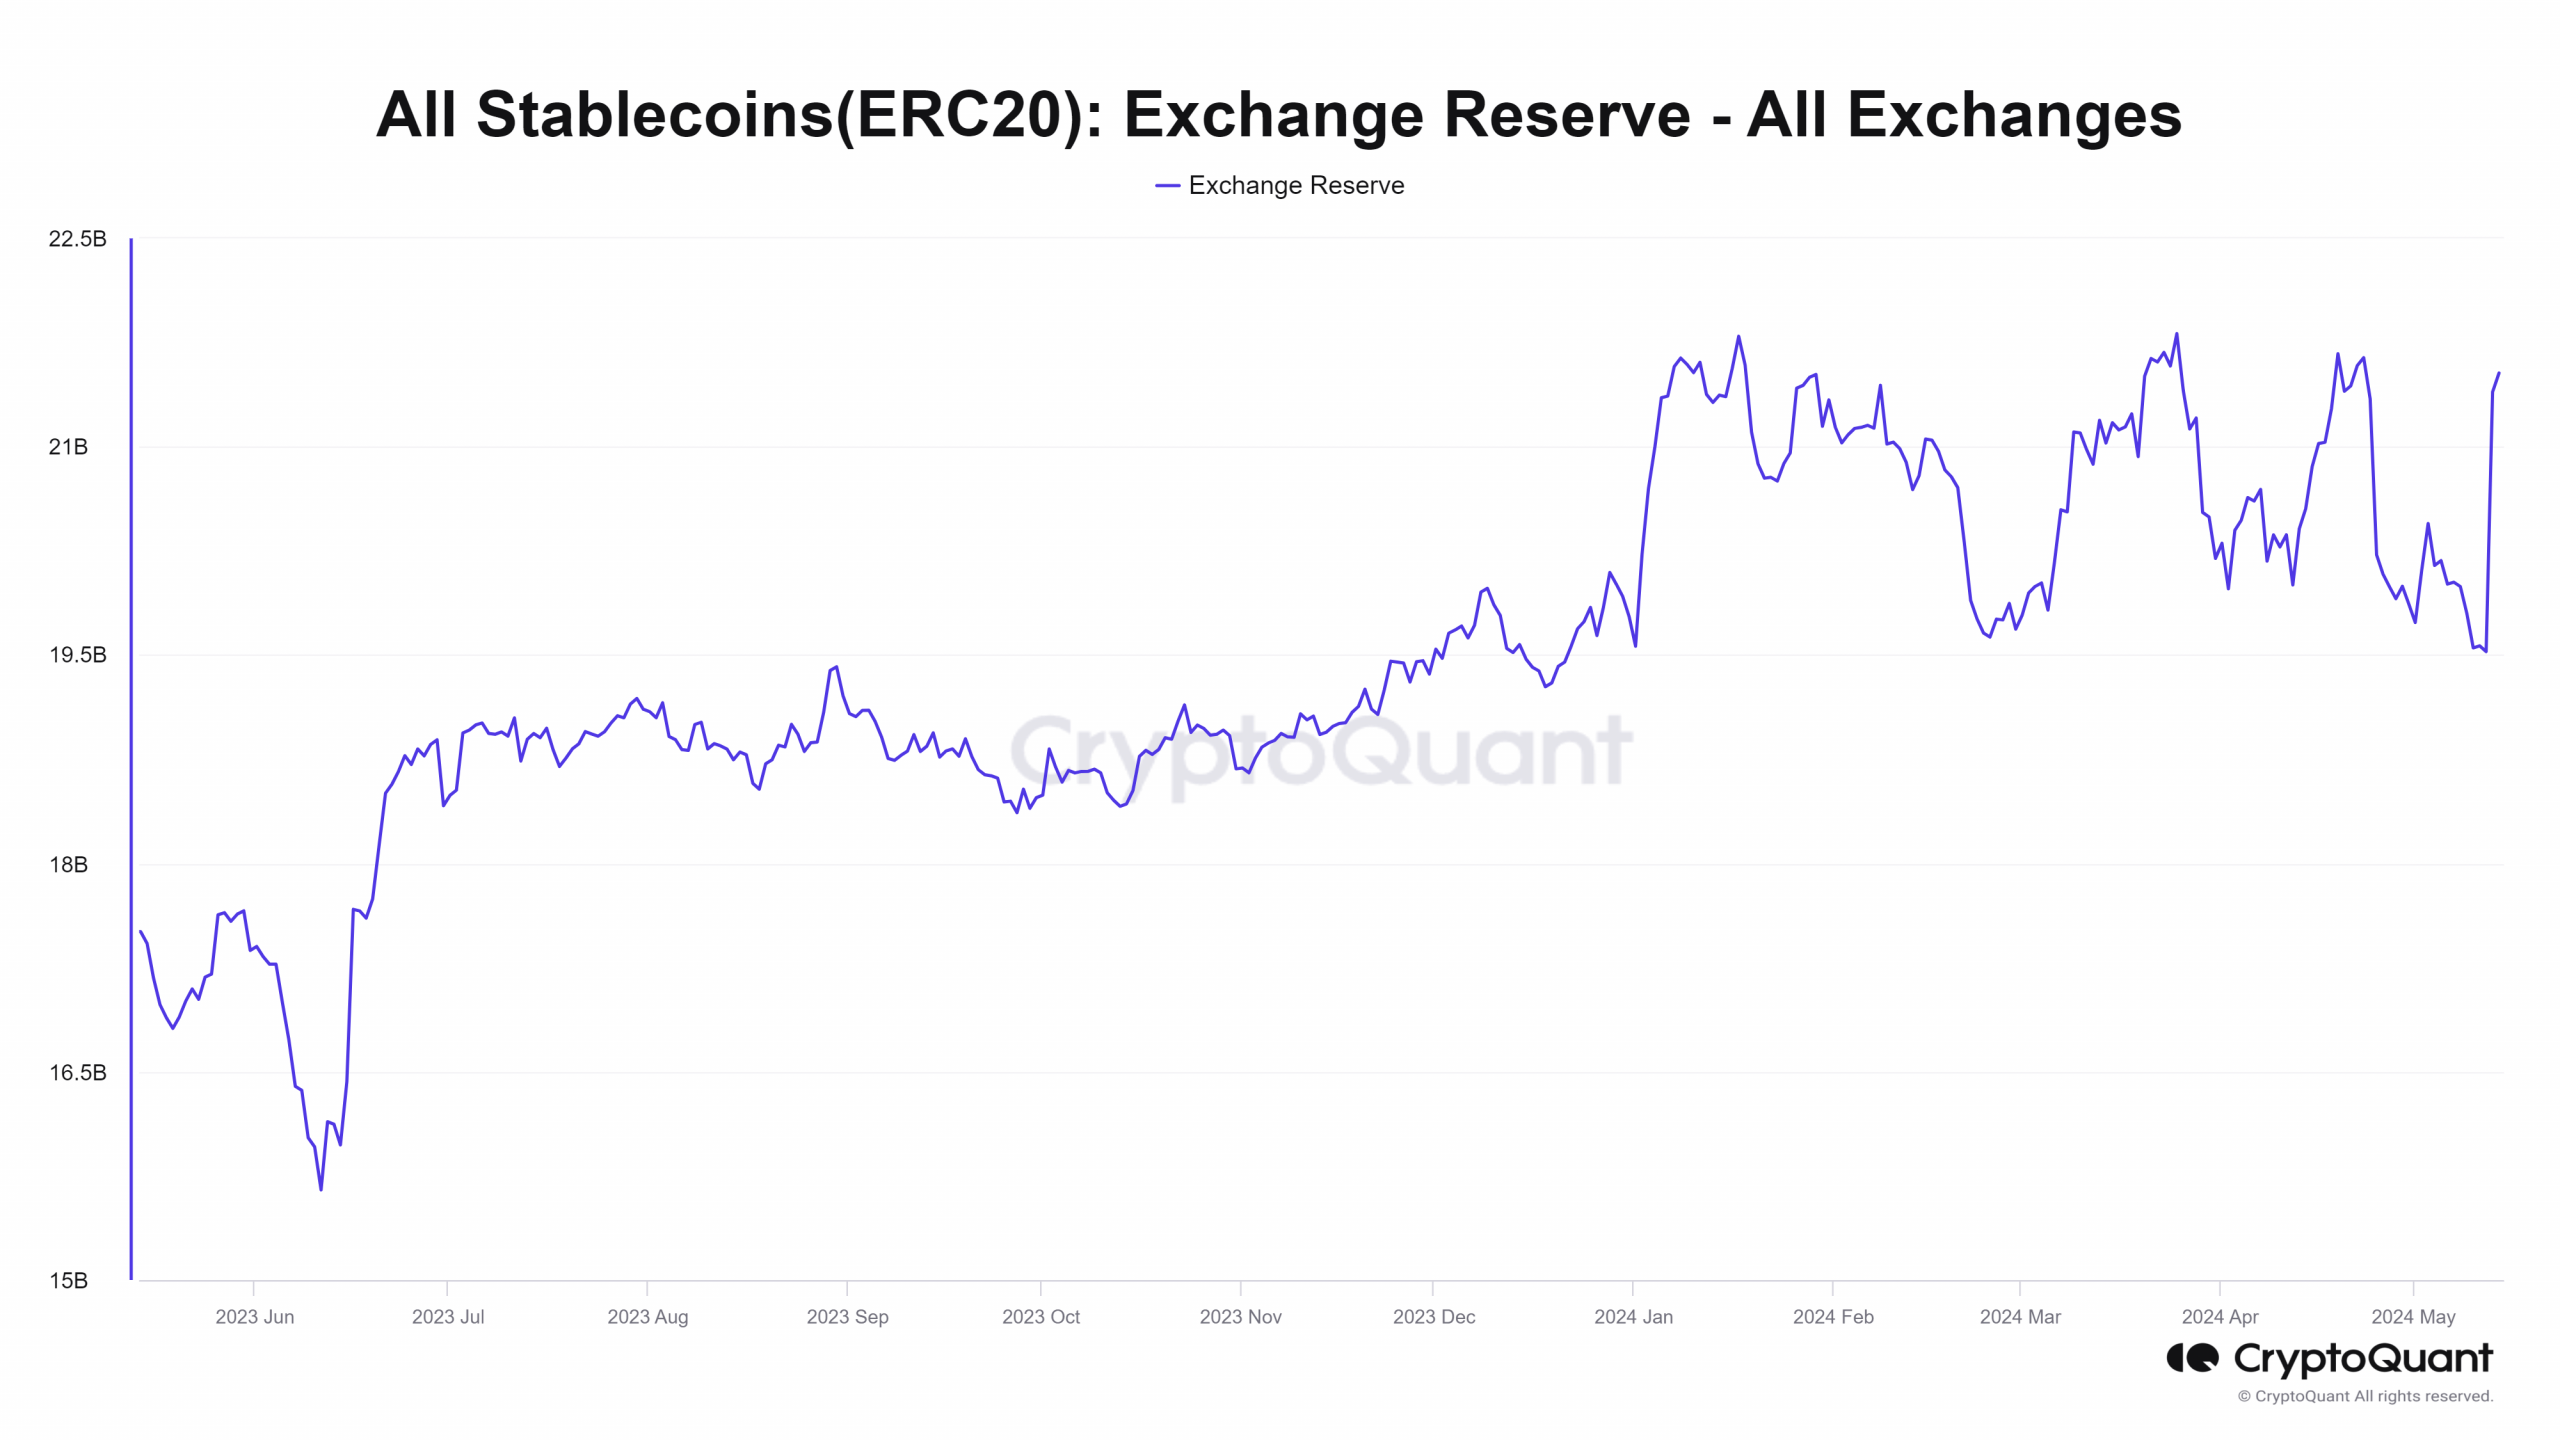
The exchange reserve has consolidated within a range in 2024. It dropped swiftly from the 23rd of April to the 10th of May, showing a pronounced decrease in buying power.
This implied that stablecoin holders were less able to spend their stables to buy crypto assets.
This changed on the 13th of May, as a sharp inflow of stables was spotted. Ideally for the bulls, the stablecoin exchange reserve continues to trend higher in the coming days.
When can we expect the crypto market to begin trending higher?
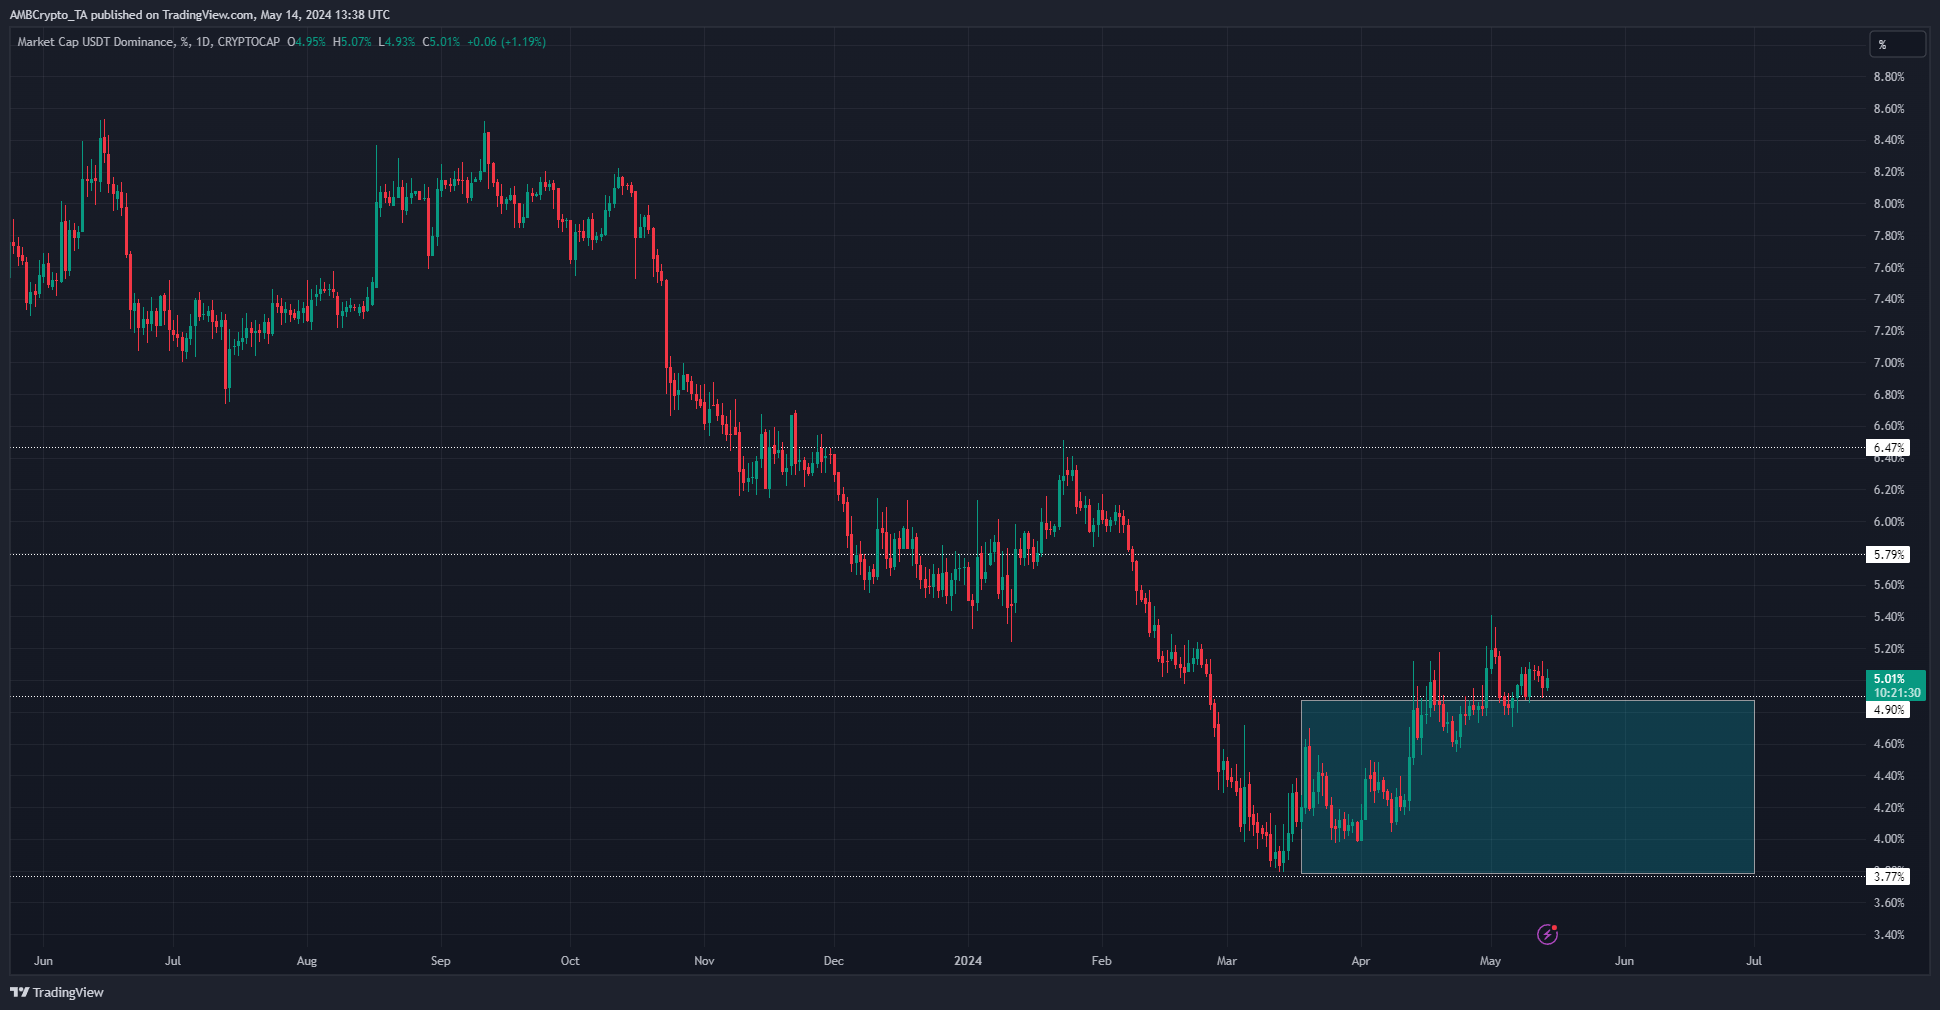
The Tether [USDT] Dominance chart tracked the market capitalization of USDT as a percentage of the total crypto market cap.
An uptrend in this metric shows participants preferred holding stables and remaining sidelined.
On the other hand, a downtrend usually comes alongside a market-wide rally. With USDT.D above the 4.9% support level, it is expected to move higher toward the 5.79% resistance.
Is your portfolio green? Check out the BTC Profit Calculator
If it can subvert expectations and drop lower, bulls can take it as a sign that going long is favorable.
However, technical and fundamental analysis of the crypto assets in question is still preferred before buying them, rather than relying solely on the Tether Dominance chart.


