Stacks [STX]: A 165% 7-day rally, will the bull run continue in March?
![Stacks [STX]: A 165% 7-day rally, will the bull run continue in March?](https://ambcrypto.com/wp-content/uploads/2023/02/PP-2-STX-cover-e1677158243657.jpg)
Disclaimer: The information presented does not constitute financial, investment, trading, or other types of advice and is solely the writer’s opinion.
- The huge rally of Stacks might be near its end, but that does not rule out a push past $1.
- Short sellers must be extra cautious.
The Ordinal craze was witnessed earlier this month. To date, more than 150k inscriptions were made, according to Dune Analytics.
The number of Ordinals created has a tangible effect on the blockchain transaction count, and was likely behind the surge in transaction fees in the past six weeks. In early January, fees were at $0.7, but they reached a peak of $2.46 on 15 February. Stacks has benefited enormously in recent weeks.
Read Stacks’ [STX] Price Prediction 2023-24
Stacks is a Bitcoin layer that enables dApps and smart contracts. The rise of Ordinals meant that demand to transact on Bitcoin’s blockchain could rise.
Although Stacks is built on top of Bitcoin and is not a scaling solution, the demand for its token STX has shot through the roof in recent weeks.
Stacks leaves a large imbalance on the charts- but will it get filled in the coming weeks?
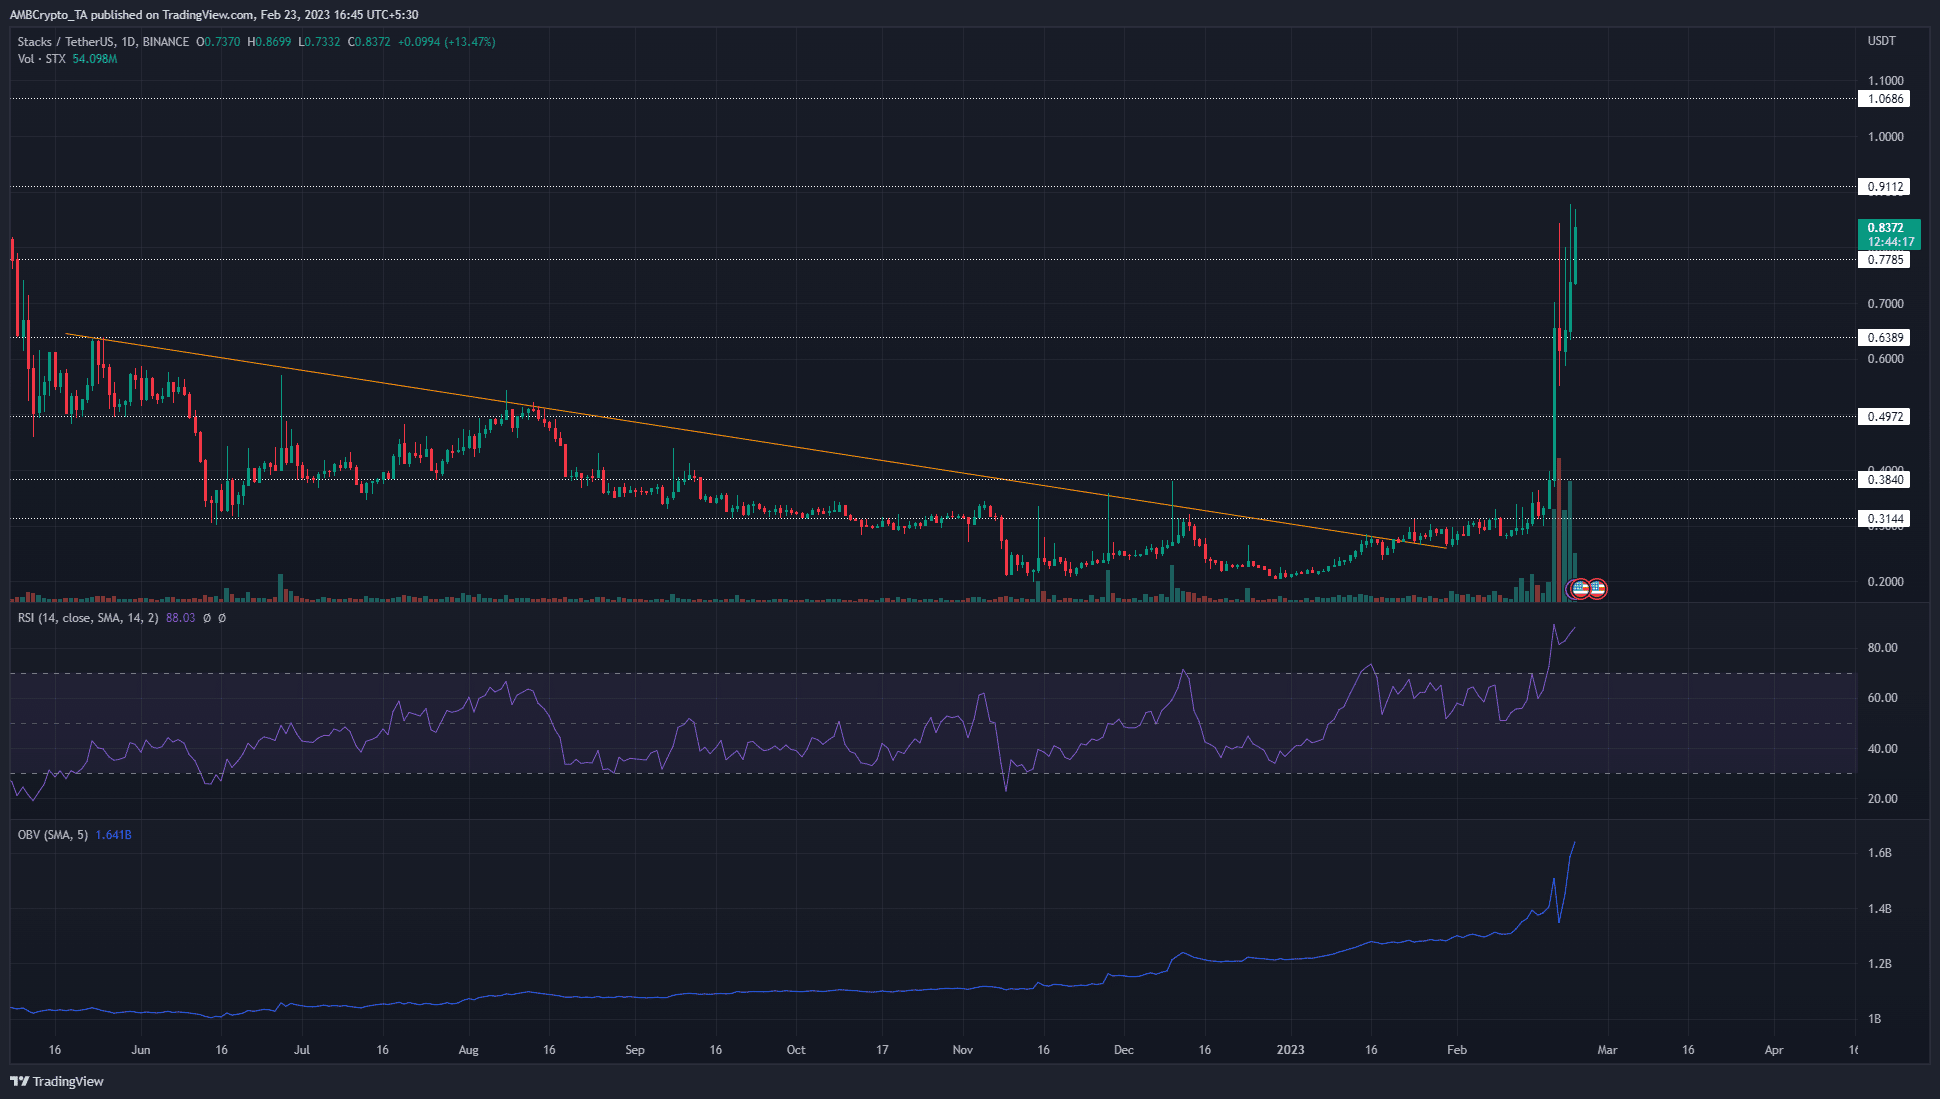
The price charts showed a persistent downtrend since January 2022. Since late May 2022, STX has toiled beneath a descending trendline resistance. The downtrend and the series of lower highs saw a false breakout in early December, but these gains were quickly reversed.
Early last month, this trendline was breached once more. Subsequently, the prices consolidated beneath the $0.31 resistance. The OBV has been on the rise since August, even though the prices had been falling steadily.
The breakout and rally in February were enormously strong. A retracement, even one as deep as $0.4, would likely be healthy for the market in the long term. However, such a retracement might not occur if buyers do not relent. Not all imbalances on the chart will be filled.
How much are 1, 10, and 100 STX worth today?
To the north, the $0.91 and $1.06 levels are the significantly higher timeframe resistance levels. Between these levels lies the $1 psychological resistance level, which can oppose the price movement upward as well.
Short liquidations showed participants trying to fade the rally (unsuccessfully)
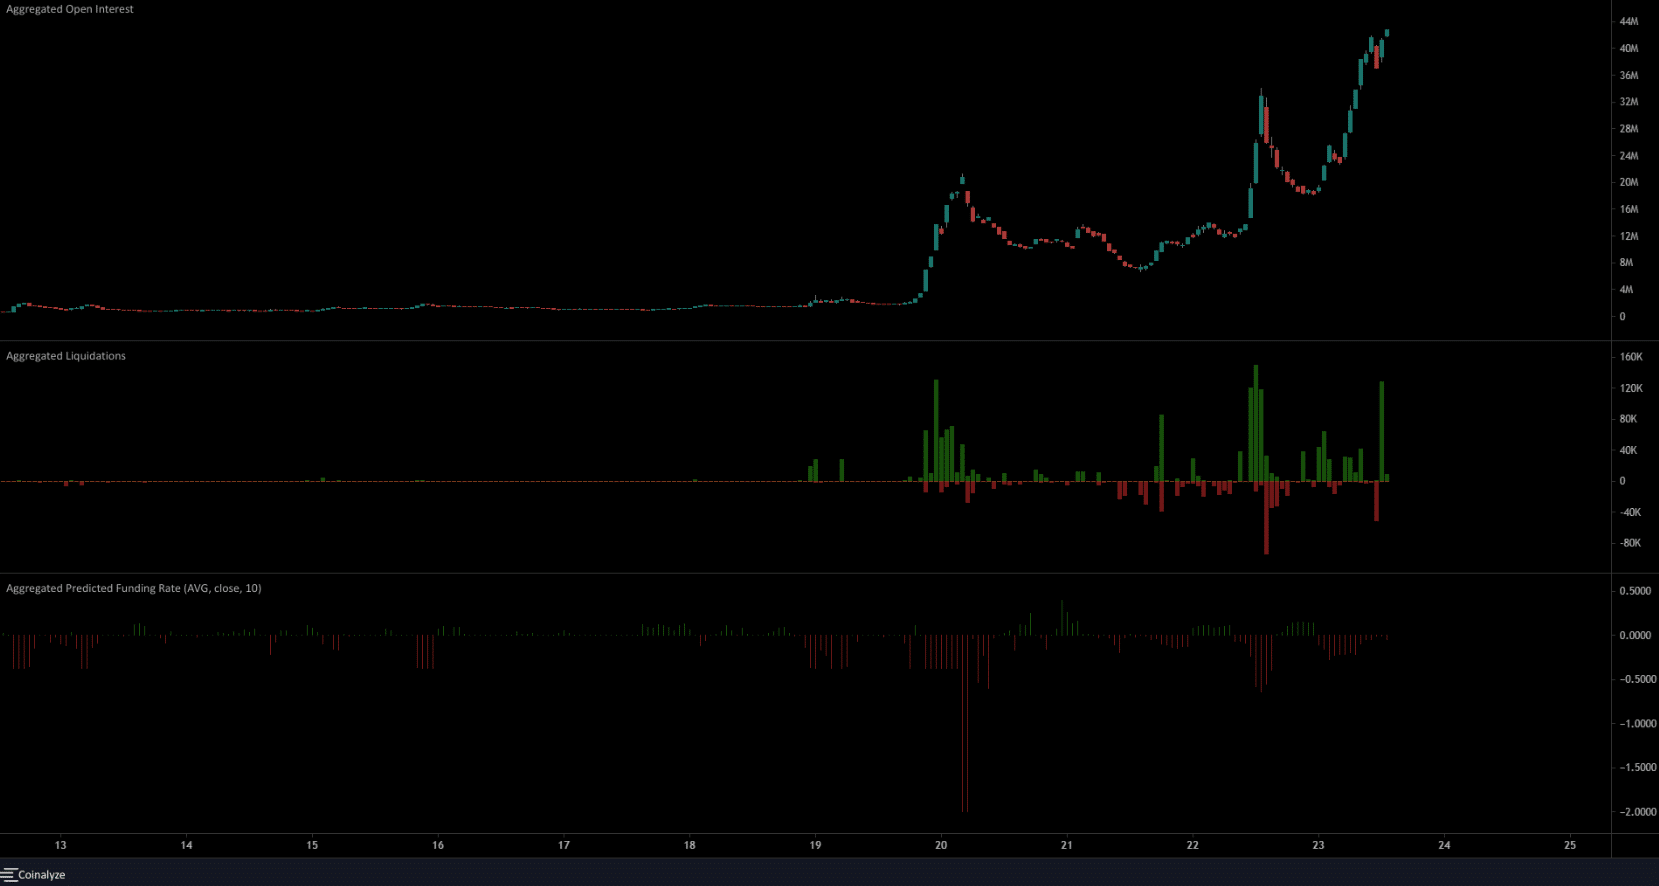
Counter-trend trading is a remarkable skill and one that can generate enormous profits. However, when a coin decides to go parabolic, shorting the asset might not be the best idea.
The 1-hour chart on Coinalyze showed trading sessions with over $100k of short positions liquidated. Denoted by the green bars, these liquidated positions were forced to buy the asset and drive prices higher.
The predicted funding rate was also negative. The large, indecisive candle on 20 February might have contributed to the large negative swing in the funding rate.
Despite a bearish outlook across the STX market, further gains can not be ruled out. This was because the Open Interest has been rising, and alongside rising prices, the conclusion was that sentiment remained bearish.