Stellar: Bulls can leverage this opportunity on XLM’s charts

Disclaimer: The findings of the following analysis are the sole opinions of the writer and should not be considered investment advice
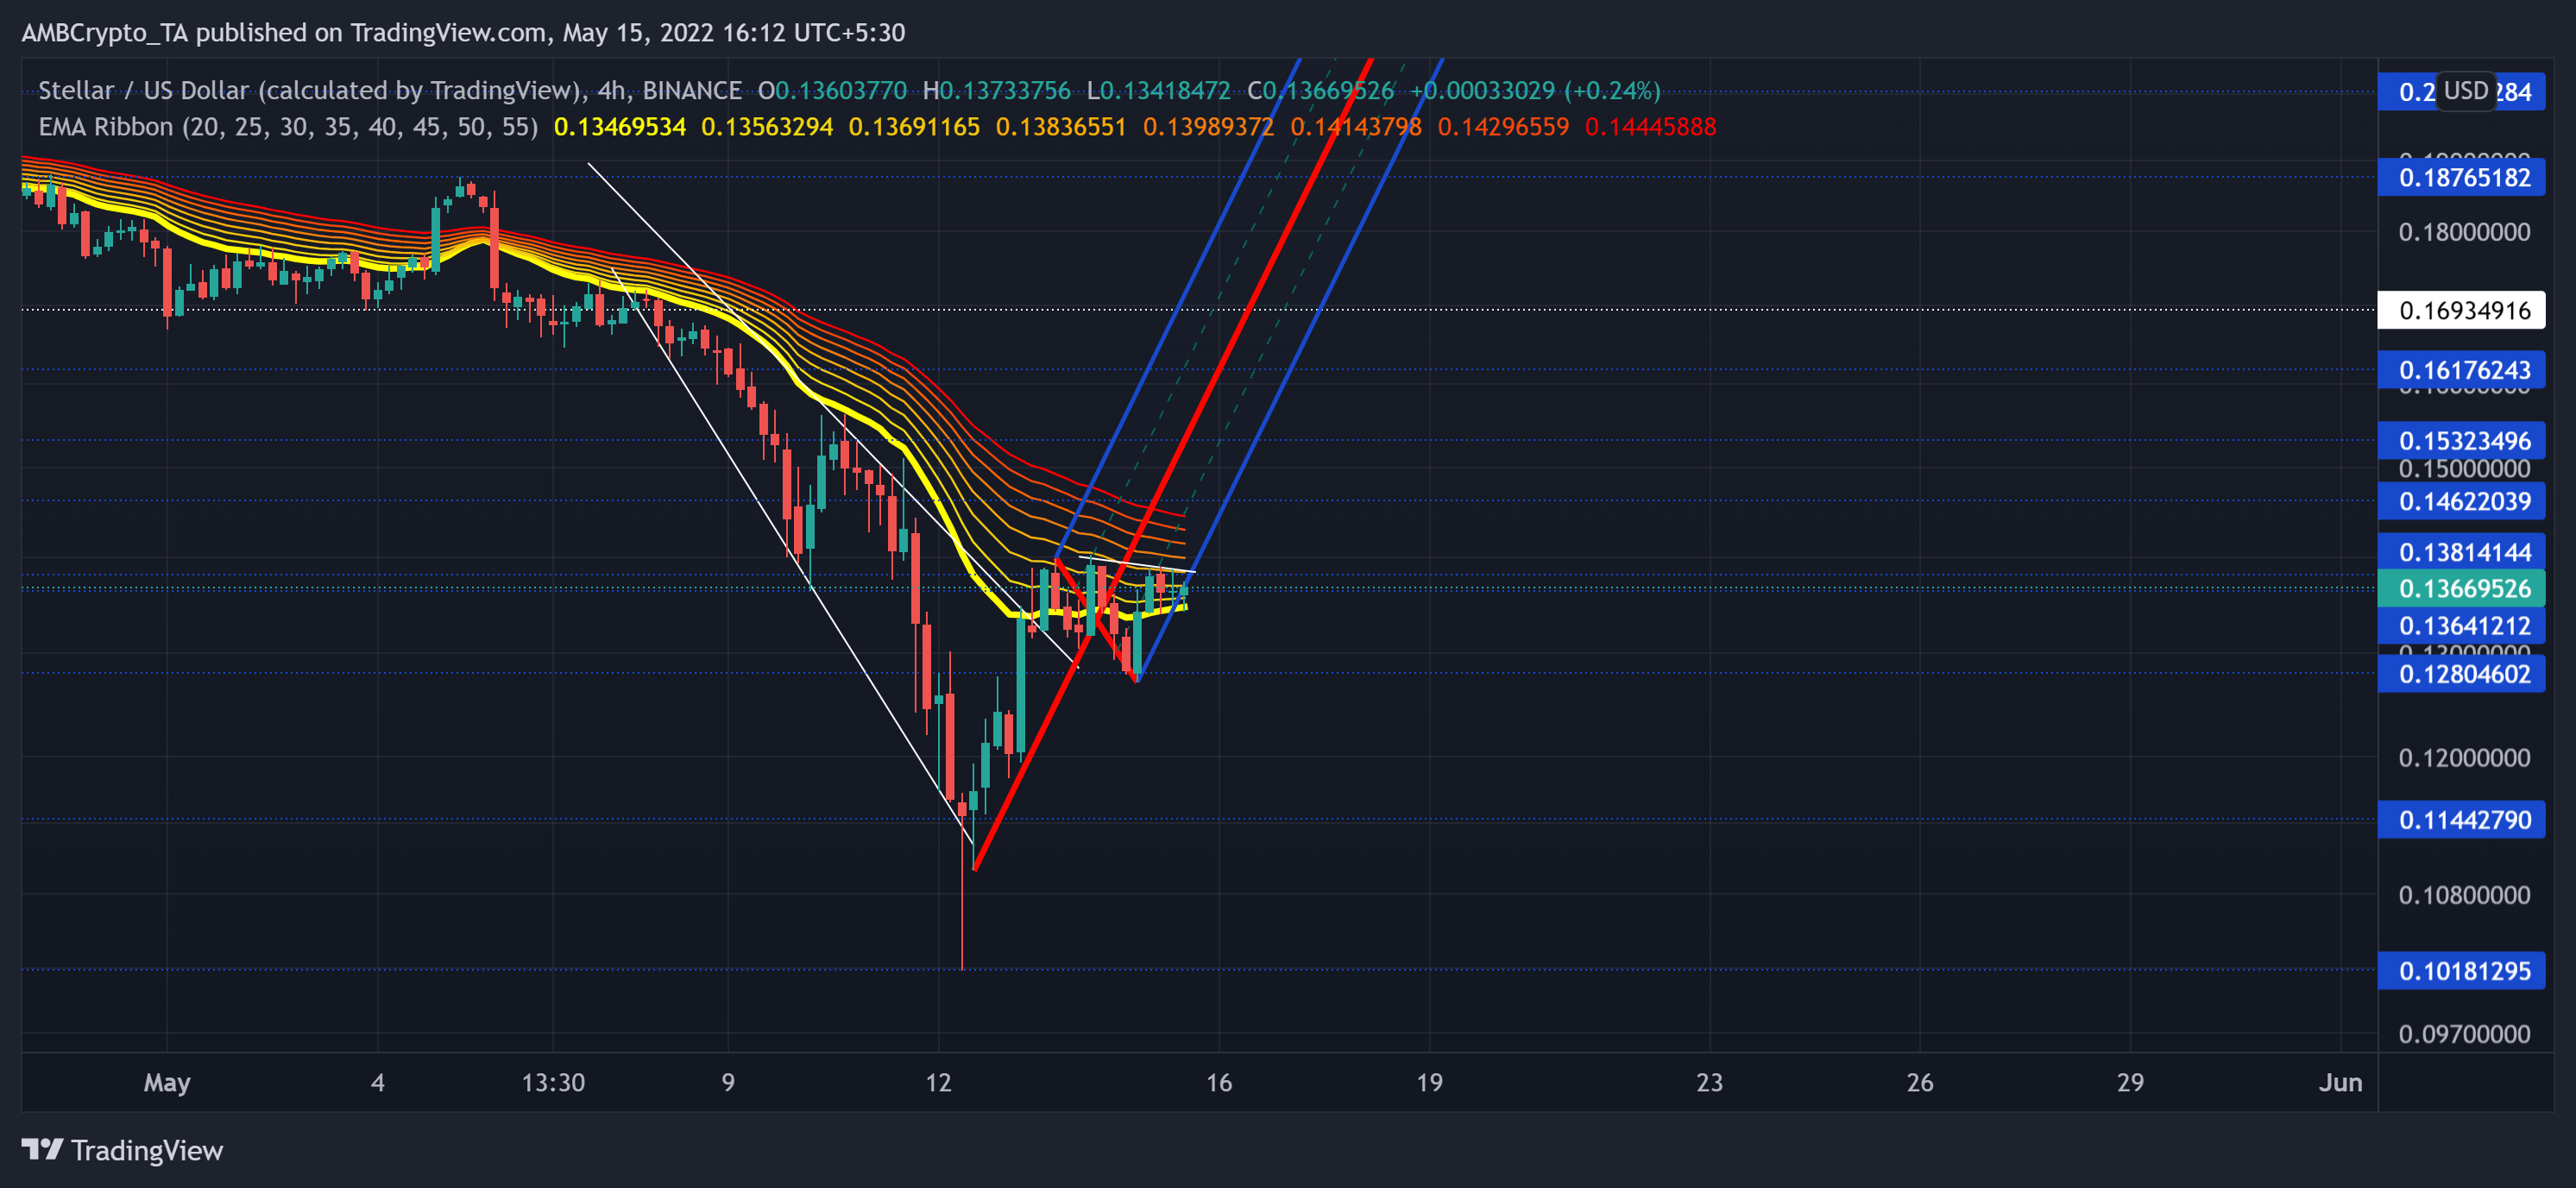
Stellar (XLM), at press time, was hovering near the lower boundary of its Pitchfork and was walking on thin ice after its recent movements. A close below Pitchfork could spiral into undesired losses by paving a pathway towards the $0.12-zone.
To reignite a short-term bull run, the altcoin needs to renew its buying pressure and find newer highs beyond the constraints of its EMA ribbons. At press time, XLM was trading at $0.13669, up by 2.4% in the last 24 hours.
XLM 4-hour Chart
XLM took a quick U-turn from the $0.2396-level and plunged to retest its $0.1693-floor. Interestingly, the bulls had upheld this floor for over 16 months. Alas, the prevailing bearish vigor gave the sellers enough thrust to propel a 40.73% retracement from 7 to 12 May.
After rising from the ashes of its 17-month low on 12 May, the EMA ribbons constricted most recovery attempts in the last two days. With the bears abstaining from giving up their edge at the 35 EMA, buyers are trying to build up pressure in the $0.13-zone.
The next few candlesticks would give more insights into the bullish intentions potentially affecting the trend in the near future. An immediate recovery could slam right into the 50 EMA in the $0.14-zone before a short-term reversal. On the flip side, any close below the 20 EMA could expose the altcoin to a test of the $0.128-support.
Rationale
The neutral RSI revived itself from the oversold lows and endeavored to overturn its midline resistance. Any close above the equilibrium could heighten the pace of its recovery process in the coming sessions.
Over the previous day, the bearish CMF pulled off higher peaks in the 4-hour timeframe. This trajectory bearishly diverged with the south-looking price action peaks.
Conclusion
Considering the paucity of buying volumes alongside the potential of bearish divergence on the CMF, XLM’s recovery phase could see a short-term break within its EMA ribbons. However, the RSI’s close above the 51-level would position the alt for a more robust revival in the days to come.
Besides, investors/traders should factor in broader market sentiment and on-chain developments to make a profitable move.


