Stellar Lumens, Aave, Verge Price Analysis: 09 March

A hike in volatility could push Stellar Lumens above its $0.46-resistance level, but trading volumes would need to rise sharply first. Aave required a pickup in capital inflows to rise above the 50% Fibonacci level. Finally, a bearish divergence could see XVG lose out to the 38.2% Fibonacci level over the next few trading sessions.
Stellar Lumens [XLM]

Source: XLM/USD, TradingView
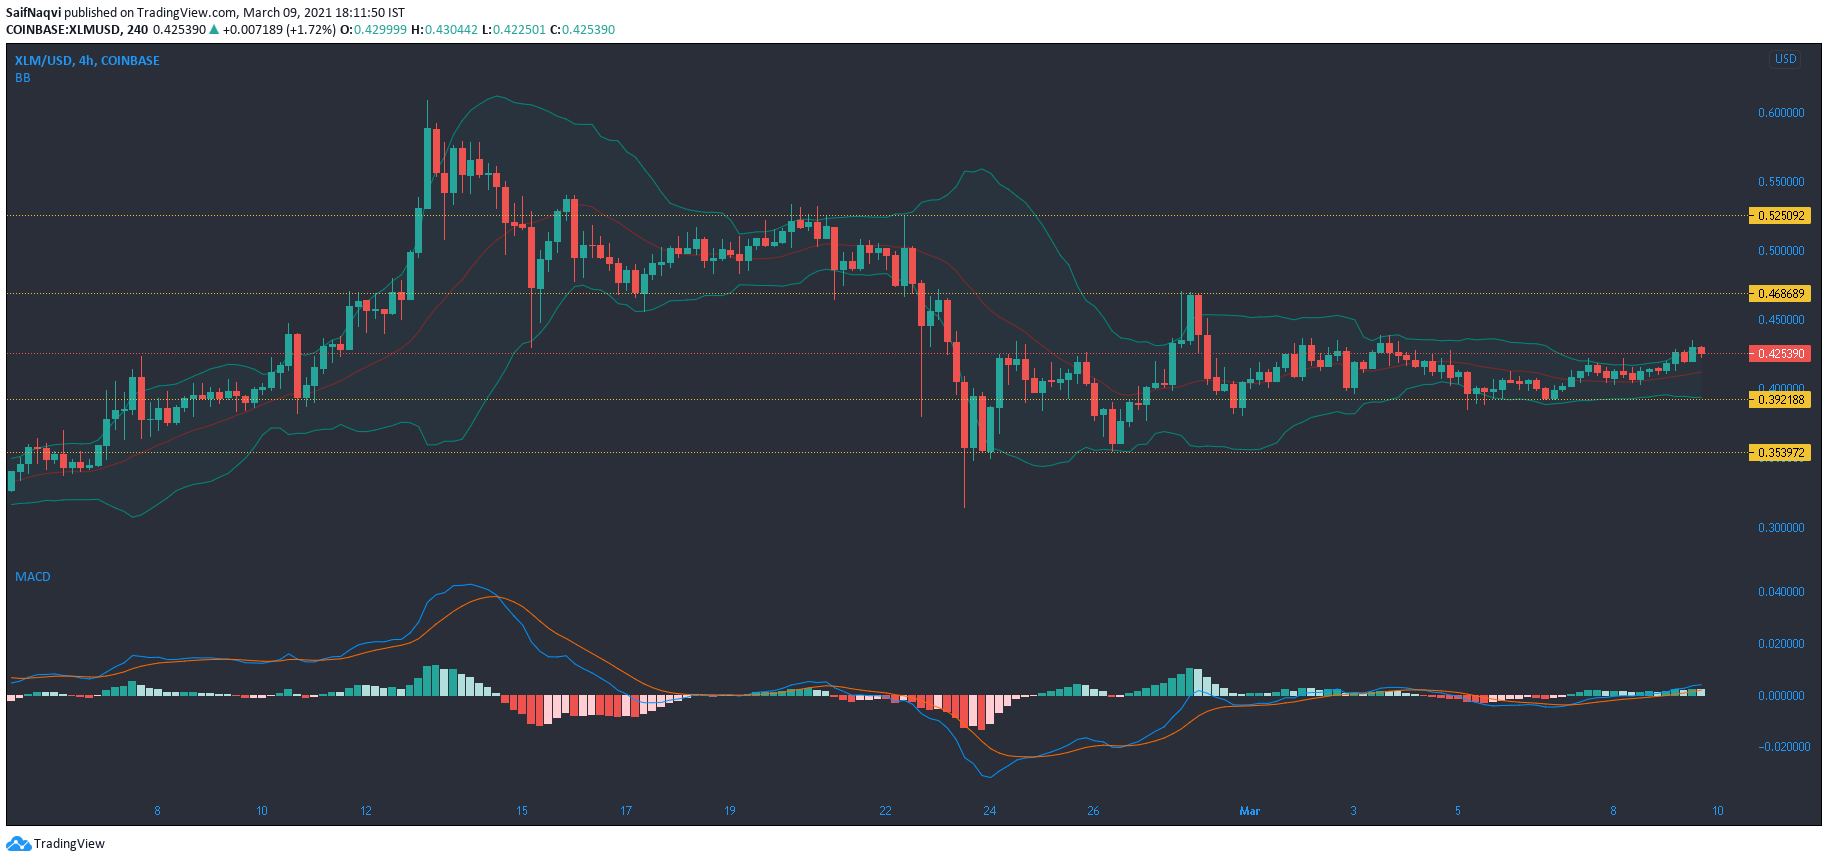
Even though short-bodied candlesticks showed consolidation in the Stellar Lumens market, the Bollinger Bands were expanding at the time of writing. This allowed for larger price swings since volatility was on the up. The 24-hour trading volumes, which had already picked up at the time of writing, can give further cues on a price hike in the coming sessions.
The MACD noted bullish strength in price as the fast-moving line remained above the Signal line, even though the histogram registered some choppy movement. All eyes would be on the resistance level at $0.46, a level that could be toppled if the broader market rally continues to push XLM upwards on the chart. Conversely, a pullback could be cut short at the $0.39-support level.
Aave [AAVE]

Source: AAVE/USD, TradingView
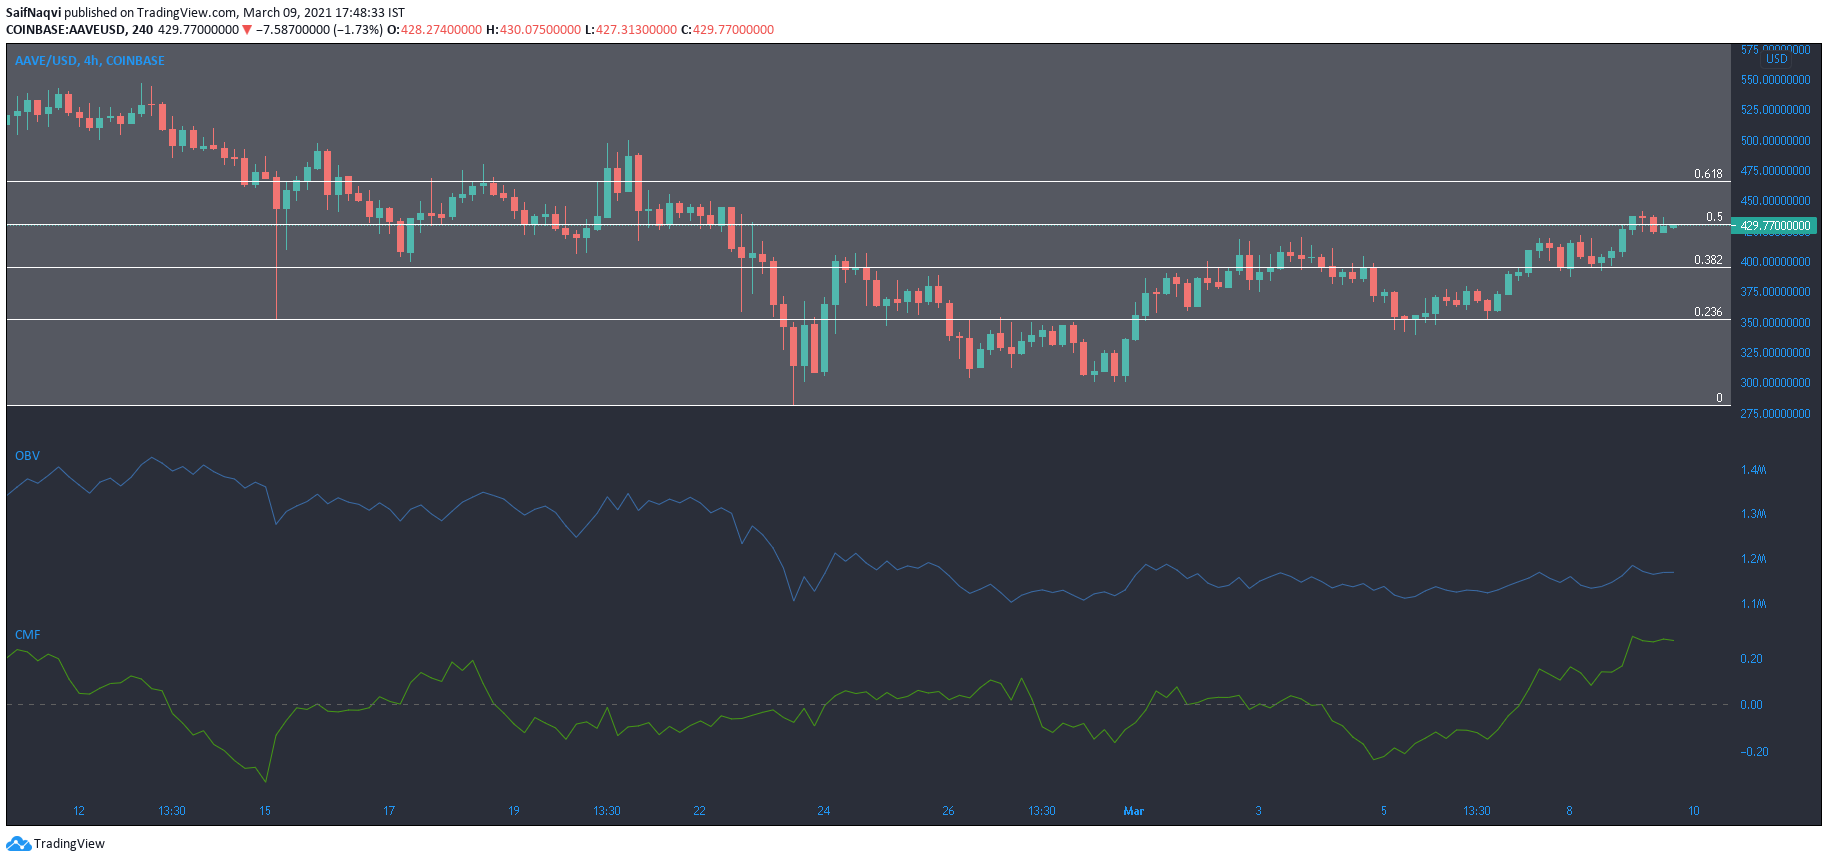
Aave surged by over 6% in the last 24 hours but rested below the 50% Fibonacci retracement level on the 4-hour timeframe. This was perhaps reflective of a lack of buying pressure in the market as the bears swiftly rejected a move above the aforementioned level. The dearth of buying pressure was also evident on the On Balance Volume after it flattened on the charts.
The Chaikin Money Flow underlined a strong correlation with the price and indicated that capital inflows were responsible for AAVE’s ascent above the 38.2% Fibonacci level. The index would need to pick up once again if the price wants to breach its overhead resistance.
Verge [XVG]

Source: XVG/USD, TradingView
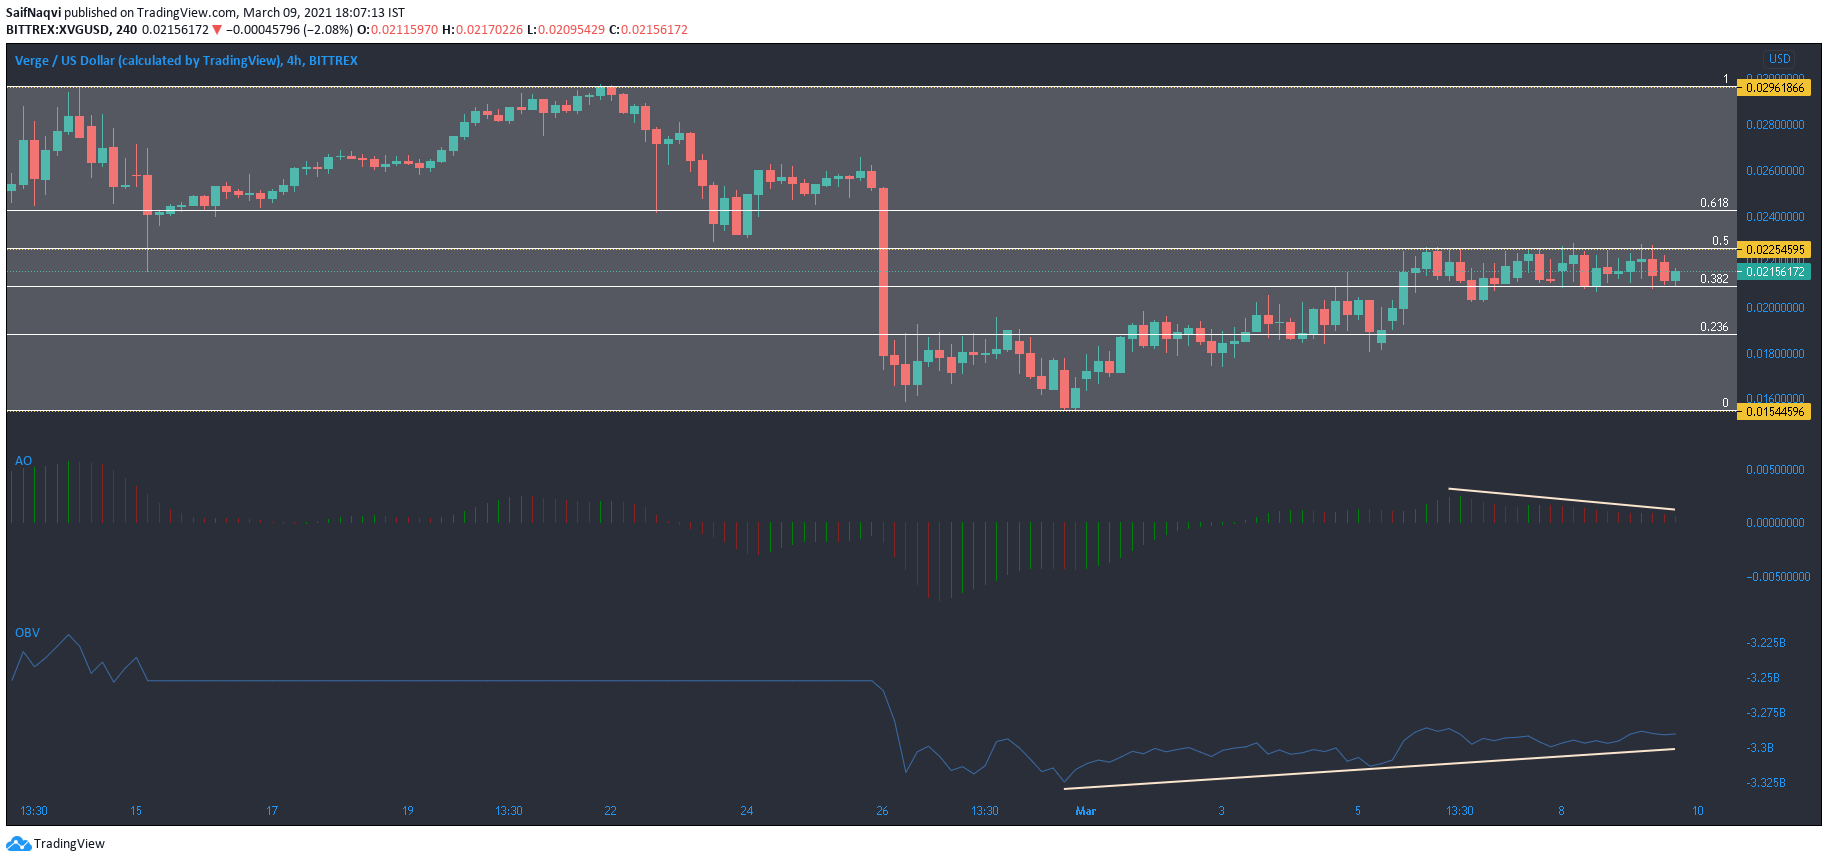
Using highs and lows of $580 and $280, respectively, some important Fibonacci retracement levels were highlighted on Verge’s 4-hour chart. The 50% and 38.2% retracement levels, in particular, formed a strong confluence with the price as XVG remained between the two levels, despite a broader market rally. In fact, the Awesome Oscillator formed a bearish divergence with the price after making lower highs over the past few sessions.
On the other hand, the On Balance Volume pictured buying at multiple levels as the cryptocurrency bounced back from the $0.015-support. A bearish scenario would likely see XVG lose out on the 38.2% level to the bears in the short-term.


