Stellar Lumens, Monero, Algorand Price Analysis: 23 December

Inspired by Bitcoin’s recent price surge, altcoins Monero and Algorand shot higher along with the broader market, while Stellar went against the trend and registered a decline in price.
Stellar Lumens [XLM]
Unable to sustain the upward momentum set by Bitcoin’s price, Stellar has seen a volatile month of December. Last week saw the crypto asset scale to a 2-week high but has retracted over the past few days. At press time, Stellar was trading at $0.15, down by 6.4% over the last week. Its weekly fall put XLM amid the biggest weekly losers for the week, among the top 15 coins by market cap.
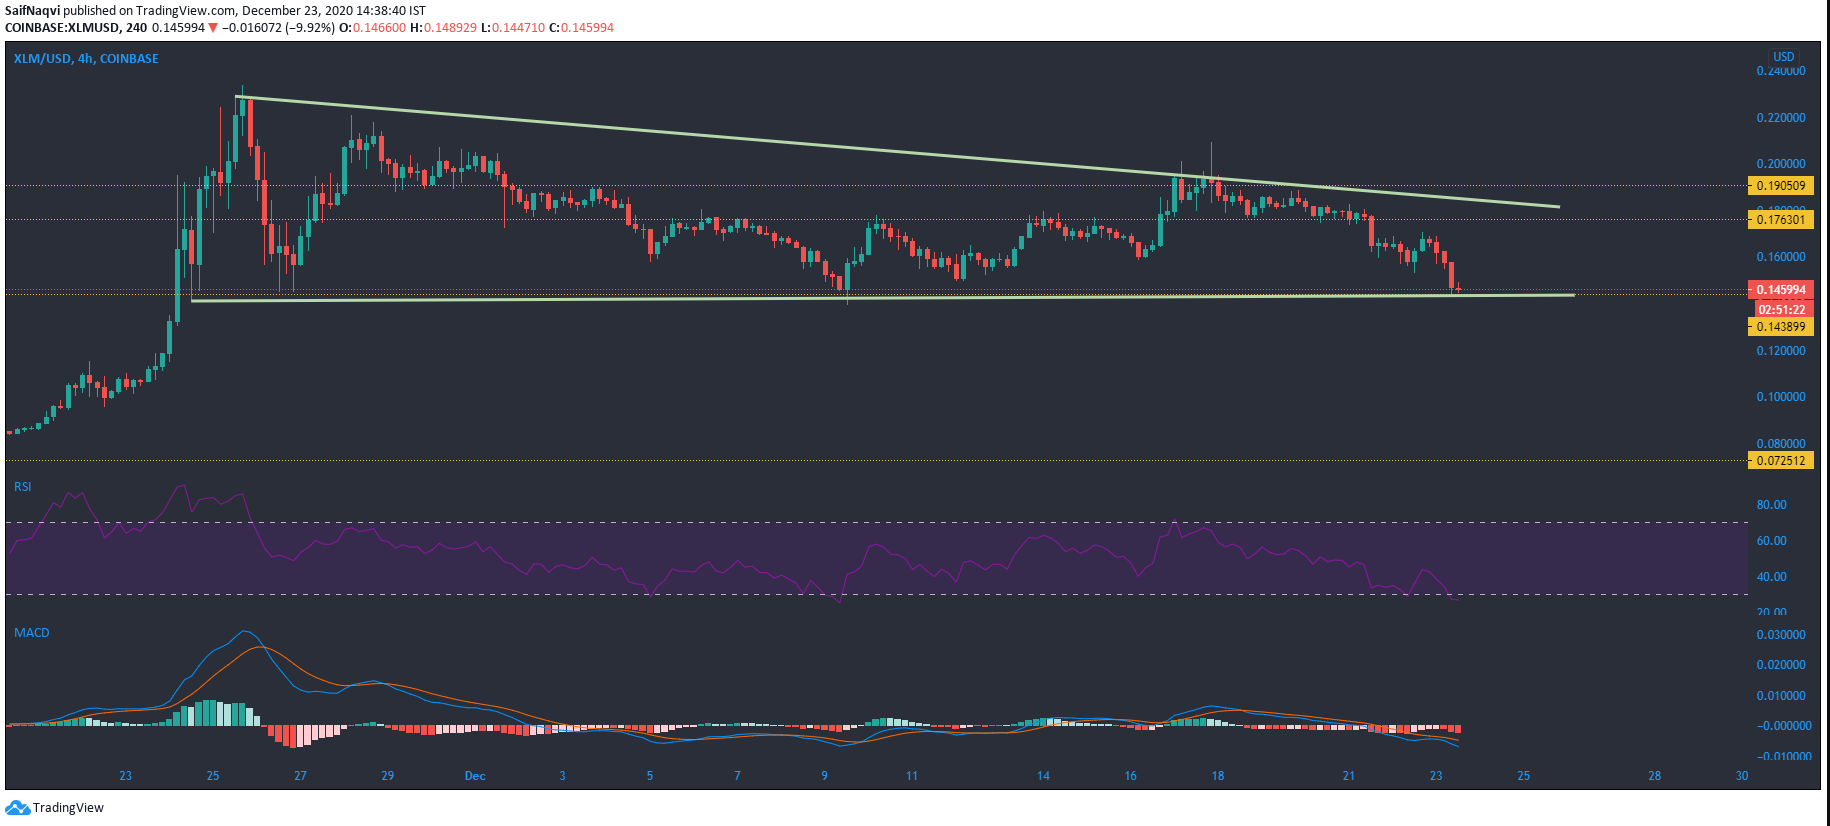
XLM’s 4-hr chart depicted that the cryptocurrency was trading close to its support at $0.144, after falling below its resistance at $0.176 a few days back. In the short term, XLM could continue to trade between the channel $0.145 and $0.176.
The Relative Strenght Index highlighted that selling pressure had persisted throughout the month as the index had been steadily declining. It now showed that prices were trading in the oversold territory.
The MACD indicated a continued period of bearishness for XLM as the fast-moving line was moving below the signal line. The red bars on the histogram also increased, signaling that XLM’s bear run could continue longer. If prices were to move below the current support level, support at $0.09 could form a defensive barrier.
Monero [XMR]
Unlike Stellar, Monero seemed to be on the path for recovery after prices had fallen post Bitcoin’s minor correction. At press time, Monero was trading at $156.6, up 7% in the last 24 hours.
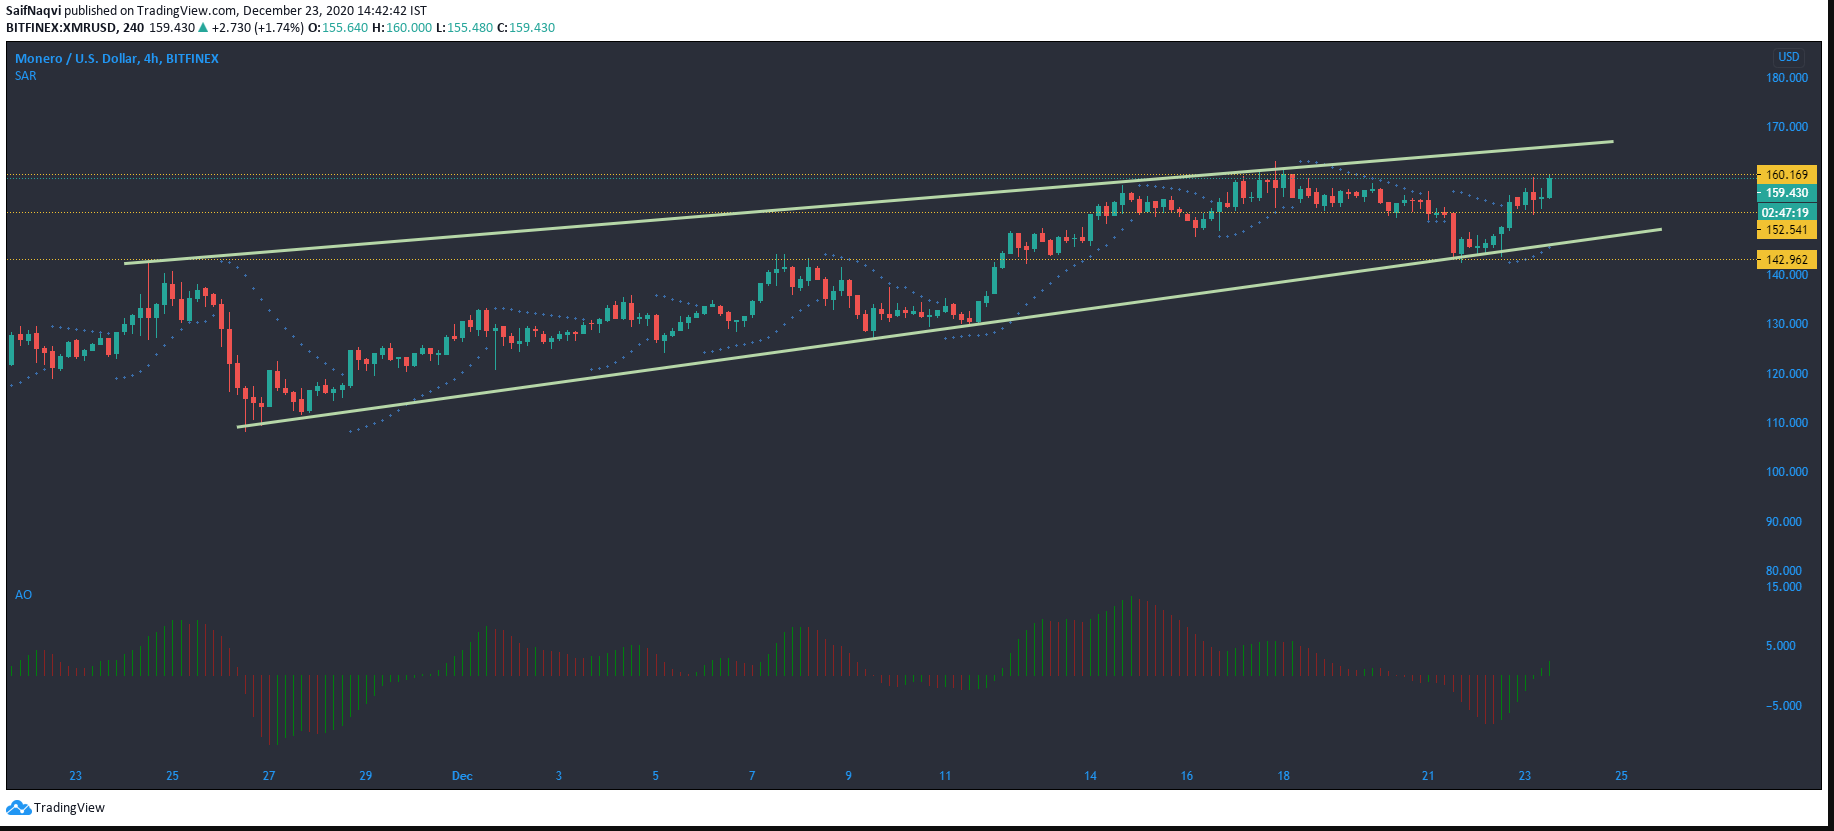
The chart depicted that Monero was in an uptrend since last November, indicated by its higher highs and higher lows. A move upwards in the past couple of days saw Monero bounce back from its support at $142 and break above the ceiling at $152. In the short term, prices could continue to move upwards and trade between the channel $152-$160, with the latter being the next resistance level.
The Parabolic SAR indicated the commencement of a short-term bull run, as the dotted line rose in tandem with prices. Resistance at $160 would be a focal point as prices could test this ceiling.
The Awesome Oscillator also depicted bullish momentum for Monero, as the green bars moved above the zero-line.
Algorand [ALGO]

Like Monero, Algorand also seemed to have been recovering after a price correction. At press time, the cryptocurrency was trading at $0.35, up 5% in the last 24 hours.
A look at ALGO’s 4-hr chart indicated that prices had been consolidating since late November, characterized by its lower highs and higher lows. In the near future, prices could continue to consolidate and trade sideways, within the channel $0.32 and $0.35.
The Bollinger Bands showed that volatility was decreasing from the past few days.
The Chaikin Money Flow indicated that capital was moving back into the crypto asset after steadily declining from mid-December. The capital inflows suggested that prices could move higher in the near future, where resistance at $0.37 could be tested.