Stellar Lumens Price Analysis: 05 April

Stellar Lumens has a YTD performance of +273.5%, and especially since mid-November Stellar Lumens has seen strong bullish moves followed by consolidation. A few days ago news arrived that Grayscale has added over 5.5 million XLM coins to its holdings.
On the charts, XLM was in another phase of consolidation, but its ascent past $0.458 in recent hours has opened the possibility of XLM being on the verge of making another strong upward move.
Stellar Lumens 12-hour chart
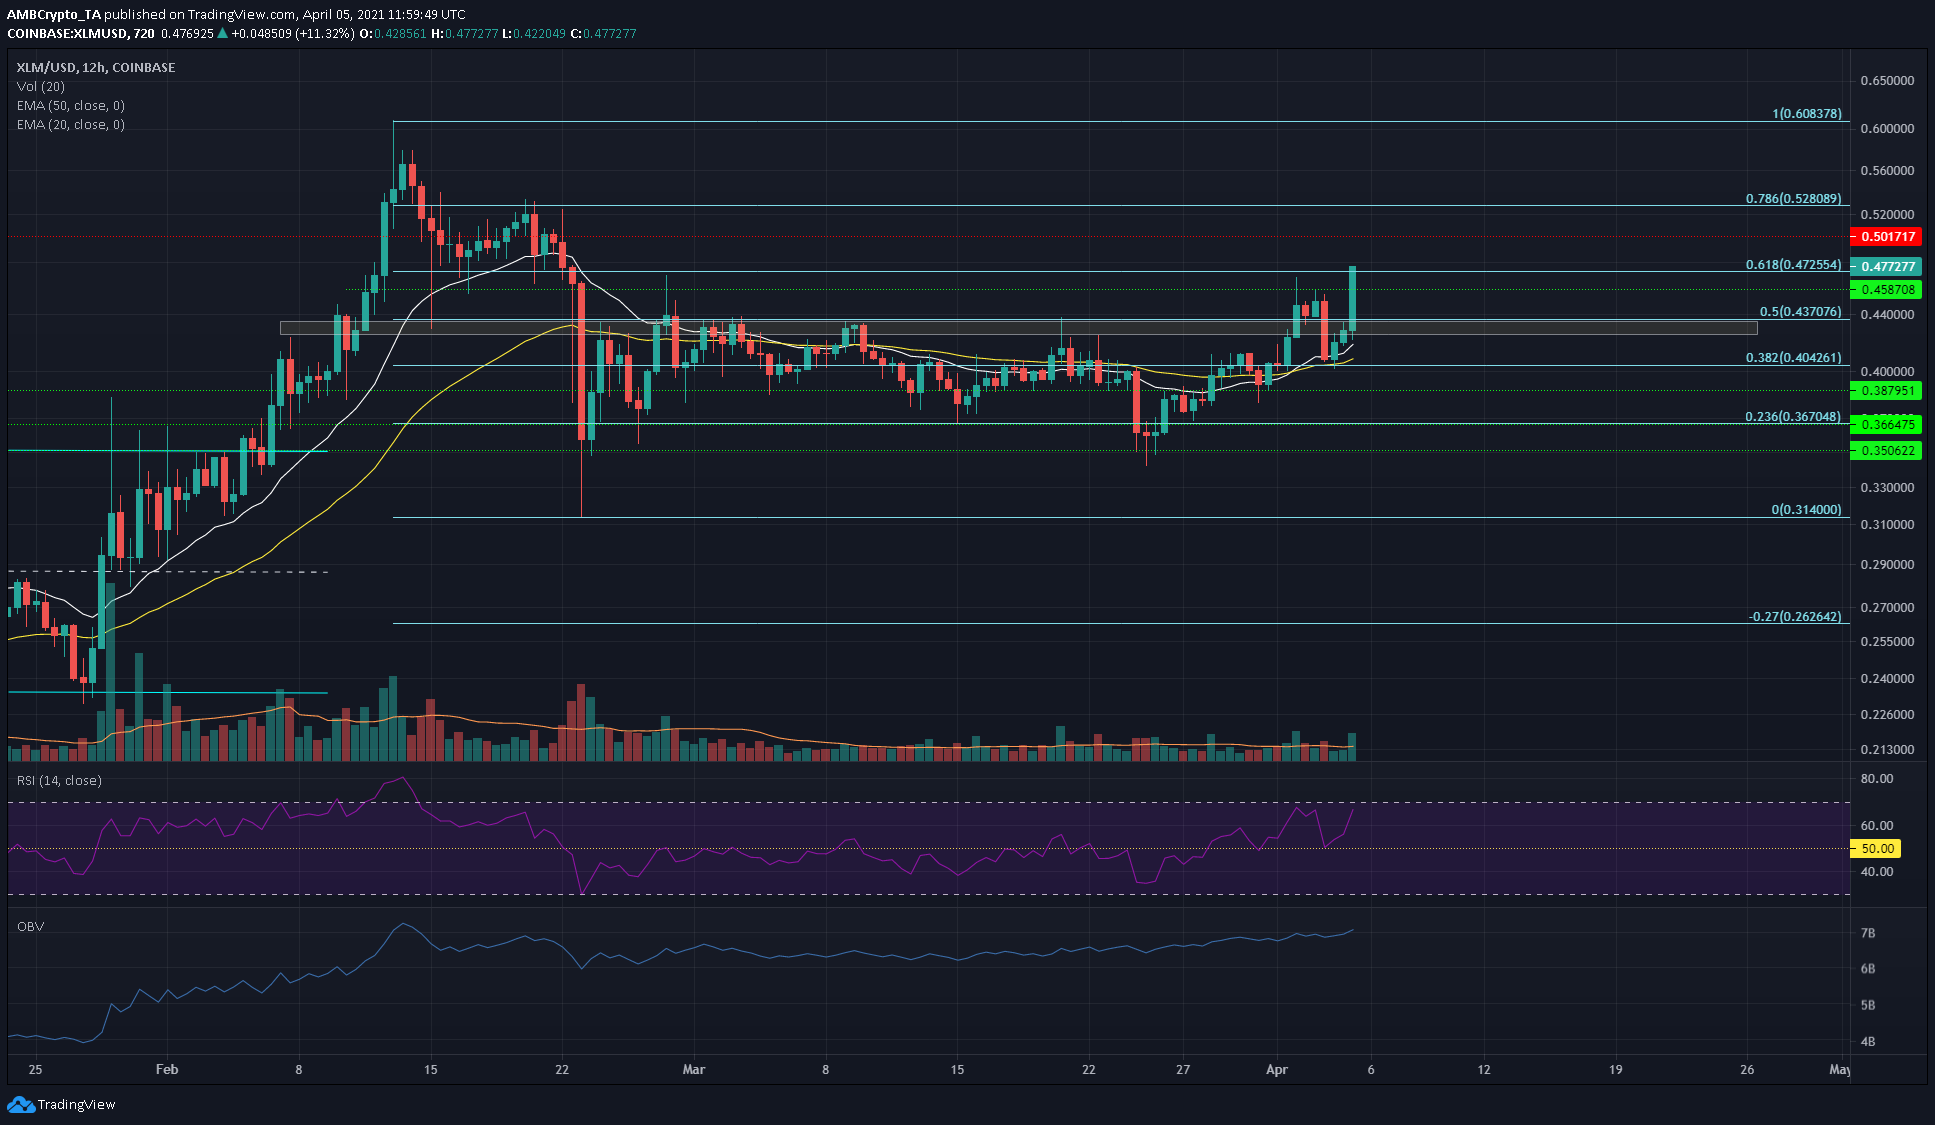
The drop from $0.6 to $0.314 in February was used to plot Fibonacci retracement levels (cyan). The 50% and 61.8% levels at $0.437 and $0.472 respectively have been of particular significance in the month of March.
Recent hours of trading have seen XLM climb past the $0.458 mark. The most recent trading session for the time-frame analyzed has not yet closed, however, technical indicators painted a bullish picture for XLM.
There is a zone of supply just beneath the 50% level, and XLM bulls have been rebuffed at this area multiple times in the past six weeks. This ascent past that region at $0.44 is a bullish development, and a minor dip back to $0.458 or $0.44 should be considered a buying opportunity.
Reasoning
The key reason is XLM’s strong move above the supply area. The trading session would be bullish if it closes above $0.44, and even more so if it manages a close above $0.458. This would indicate that bulls were firmly in the driving seat.
The RSI did not dip beneath neutral 50 and was at 67 once more, showing upward momentum was yet unabated. The OBV was also in a steady uptrend, highlighting the demand behind the rally of XLM.
The 20-period EMA (white) was moving above the 50 EMA (yellow) to show bullishness, and the 50 EMA can serve as support as well.
Conclusion
A revisit to $0.458 or even $0.44 could be seen in the coming days. These two levels can be used to scale into a long position, with a stop-loss at $0.42 or deeper, beneath the 50 EMA at $0.409. Considering the likelihood that XLM will move toward $0.6 in the weeks to come, a wider stop-loss of $0.4 would still provide a good risk-to-reward for this trade.