Stellar Lumens, Waves, IOTA Price Analysis: 20 January

Stellar Lumens moved within a fixed channel of $0.319 and $0.287, at press time, and a breakout in either direction did not seem likely over the next few trading sessions. WAVES formed an ascending channel on the charts, and a southbound breakout could see the price test the support level at $6.2. Finally, IOTA registered a shift in momentum towards the bearish side, and the support level at $0.406 could be in focus in the near-term.
Stellar Lumens [XLM]
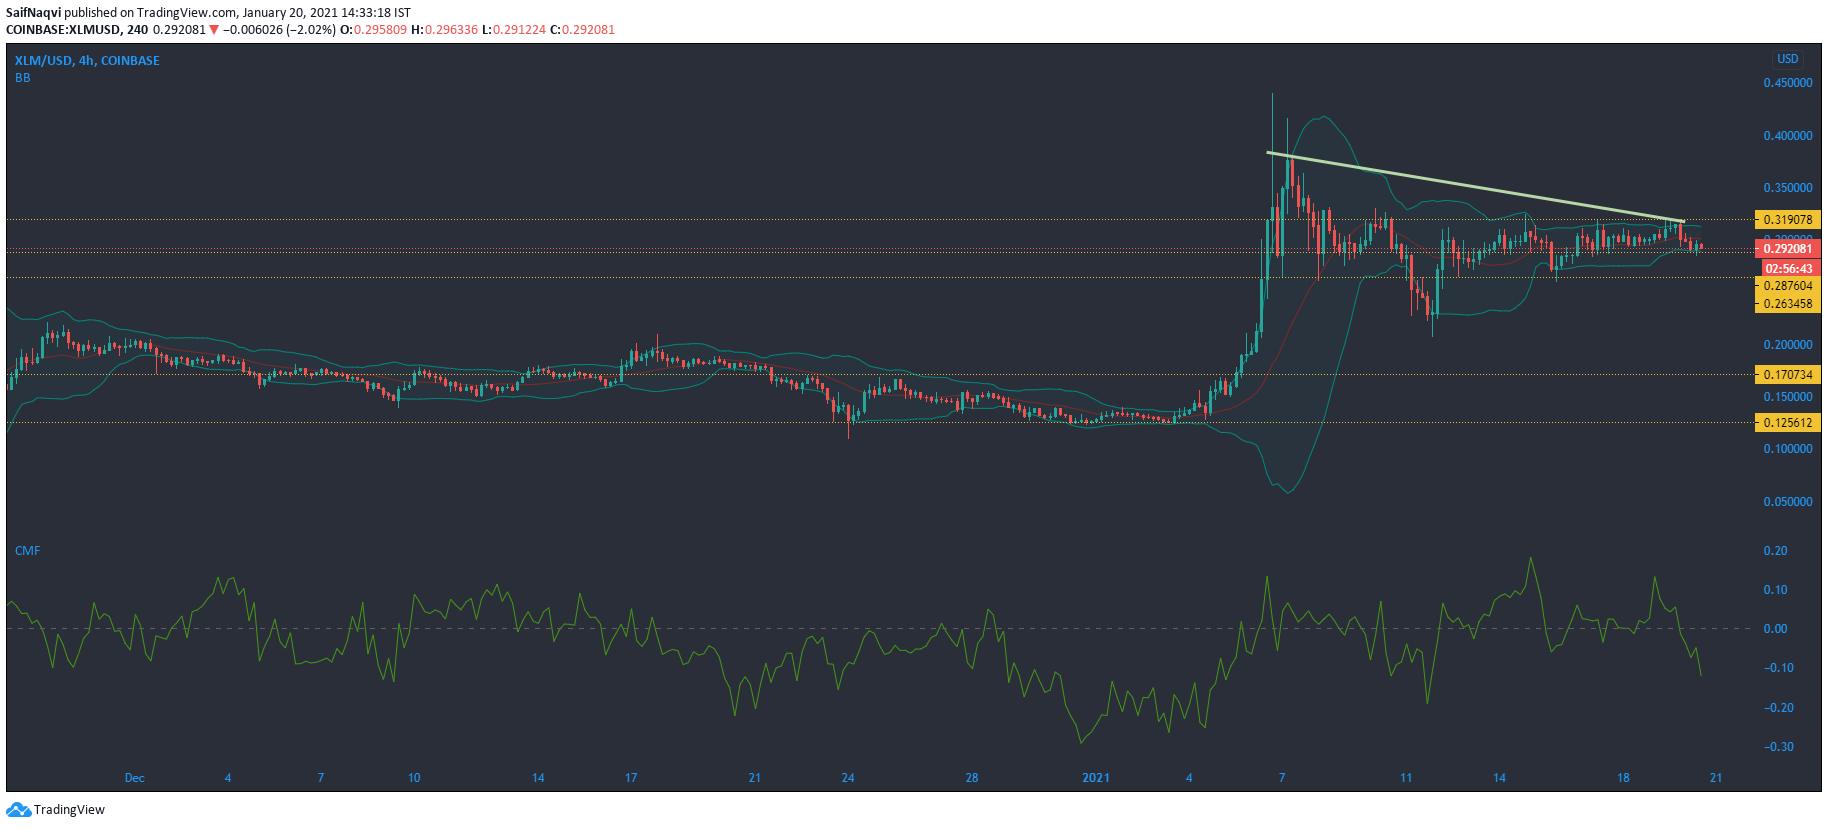
XLM’s movements have largely been restricted between the channels of $0.319 and $0.287 over the past week. In fact, since snapping a local high at $0.4 during the first week of the month, the price has traded below the strong resistance level of $0.319. At the time of writing, there seemed to be a lack of momentum in the market for a strong move in either direction, and the price could continue to trade within a restricted channel over the next few trading sessions.
The Bollinger Bands noted low volatility in price as the bands were compressed on the charts.
Finally, the Chaikin Money Flow showed that capital outflows were strong and the bulls would struggle to maintain the price above the press time support level if there is a further pullback in the broader market.
Waves [WAVES]
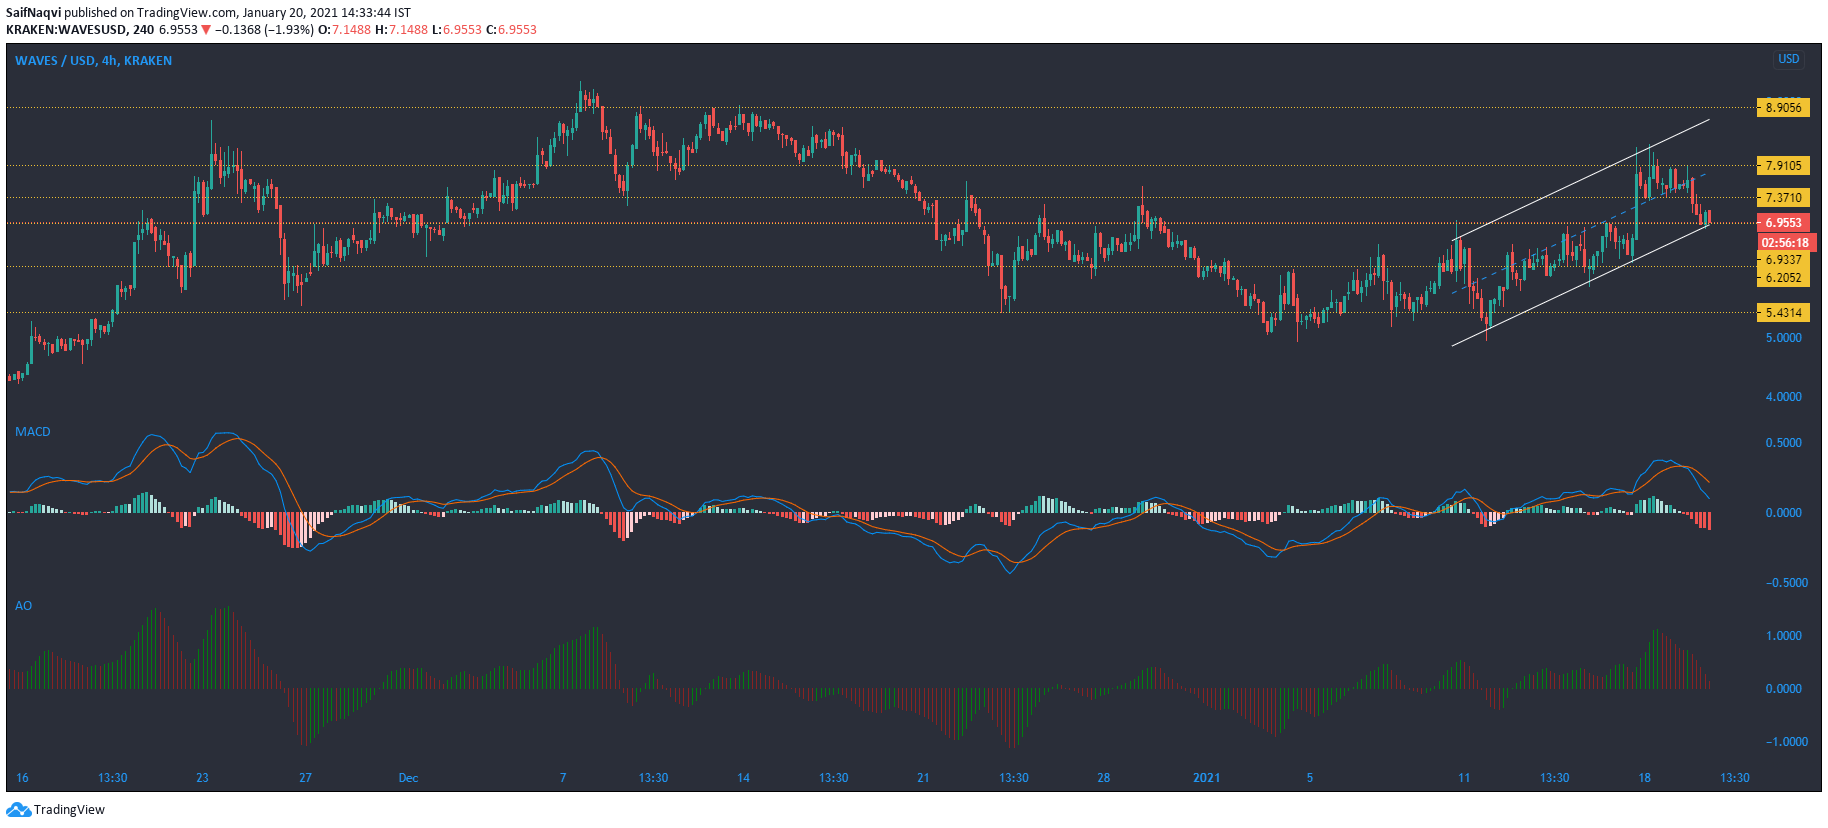
A look at WAVES’s 4-hour chart showed that the candlesticks formed a parallel ascending channel. A downwards breakout from this pattern could see the price fall towards the $6.2-support. A bullish scenario could see WAVES bounce back from the lower trendline and target a move above $7.9-resistance. However, the indicators favored the bears and predicted that the crypto-asset could move south on the charts.
The MACD’s histogram showed that bearishness was on the up. The Signal line also moved well above the fast-moving line.
The Awesome Oscillator agreed with the MACD and showed that momentum was rising on the bearish side.
IOTA

IOTA traded close to the $0.489-resistance at the time of writing, but momentum looked to flip sides and shift towards the bears in the short-term. The price could move lower towards the $0.406-support in a bearish scenario. On the flip side, a northbound breakout could see IOTA target the next resistance at $0.512.
The indicators favored the bears in the short-term as the MACD’s bearish crossover suggested that the price could move lower on the charts.
The On Balance Volume seemed to suggest otherwise and indicated that buyers were plenty in the market to prevent a southbound movement on the chart.


