Stellar Lumens [XLM] hits 24-month low; decoding the happenings
![Stellar Lumens [XLM] hits 24-month low; decoding the happenings](https://ambcrypto.com/wp-content/uploads/2022/11/po-2022-11-11T090651.993.png)
As the crypto market crumbled below the $900 billion market value, Stellar Lumens [XLM] accompanied it to reach its lowest price in two years.
According to CoinMarketCap, XLM hit $0.0828 in the early hours of 11 November. This value was the lowest it had reached since the token exchanged hands at $0.0806 on 13 November 2020.
Read AMBCrypto’s price prediction for XLM 2023-2024
While this might not be an unexpected bombshell, not many investors might have professed it hitting such lows. At the same time, it could be described as XLM following in the footsteps of its peers after recent events. Except for the price, it appeared that other parts of XLM were also affected.
Fall out season
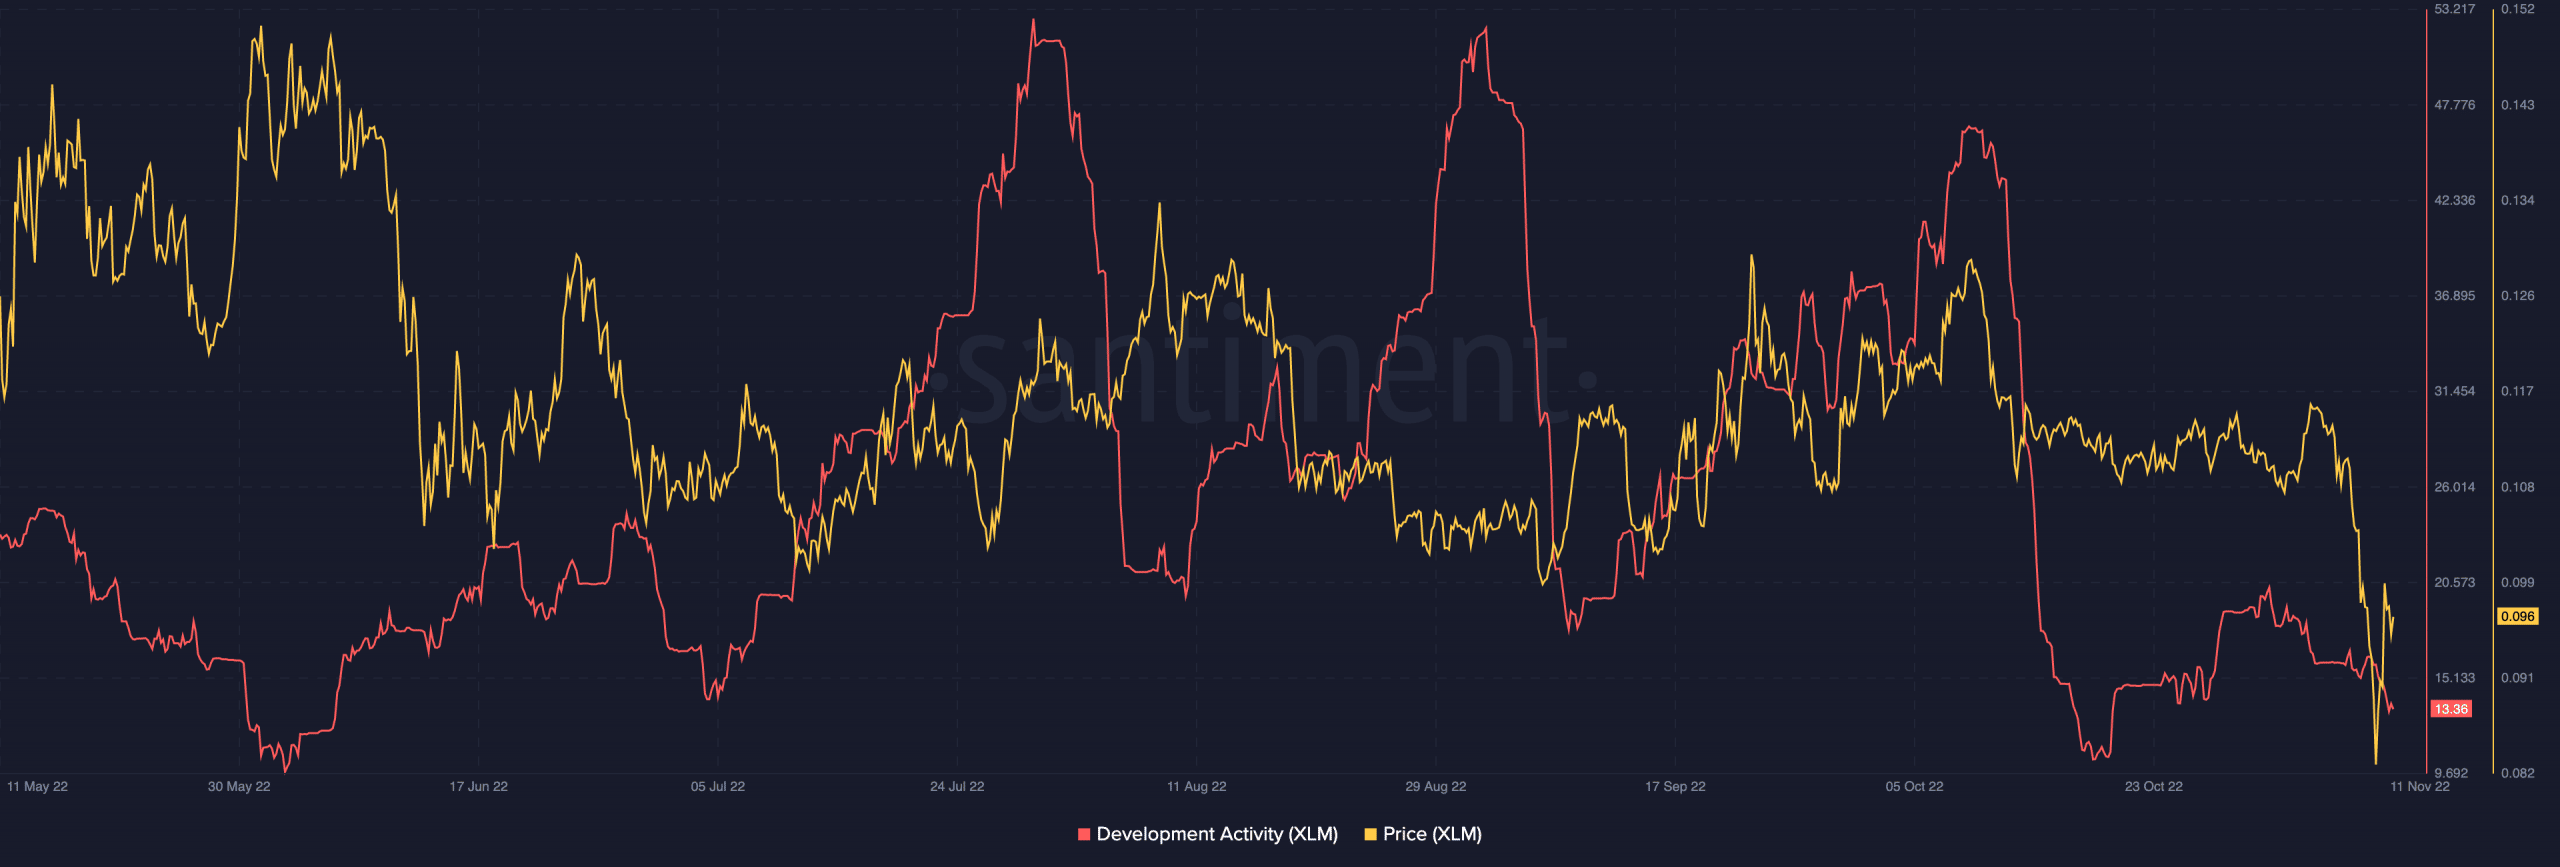
Per Santiment data, Stellar’s development activity had significantly declined. As of this writing, the development activity had plunged from 20.35 on 1 November to 13.29.
For this reason, it was clear that there had been much fewer upgrades in the XLM ecosystem. Similarly, the recent fall off of the market might not have been able to prevent a shrink even if there was a significant network boost.
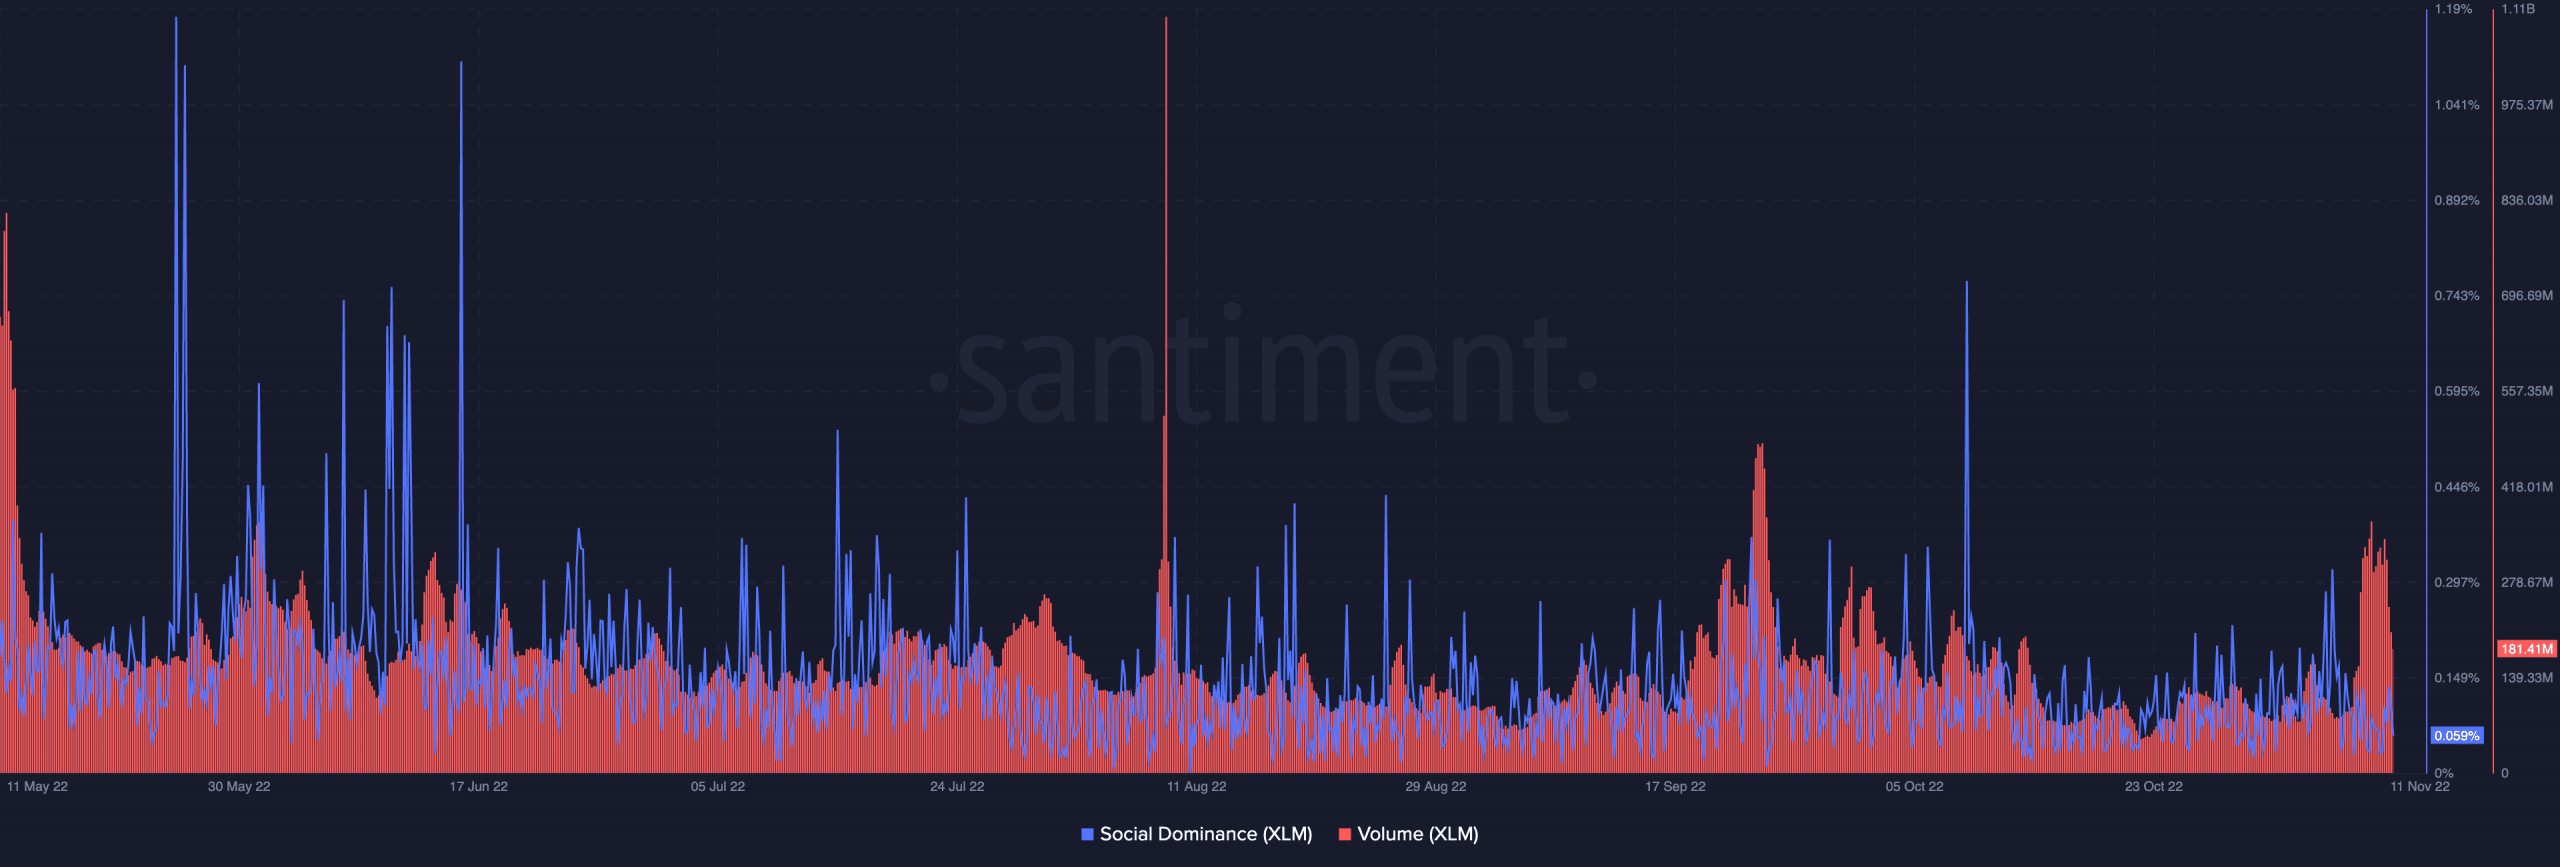
In addition, XLM investors did not trust the crypto market enough to stay put in holding the altcoin. At press time, the volume of the 24-ranked cryptocurrency had decreased by 48.39%. This data indicated that there had been increased sell-offs between the previous day till the time of writing.
Based on the above Santiment data, XLM had recovered while trading at $0.96. Still, investors who took advantage of the brief price rise preferred to exit early due to the volume decrease.
As for its social dominance, XLM seemed far from the top of minds recently. With its value at 0.063%, it inferred that only a few invested in social search and discussions about Stellar Lumens. Considering this status, you could argue that XLMs’ reversal to recovery could result from the Bitcoin [BTC] upswing.
Here’s what foresight says
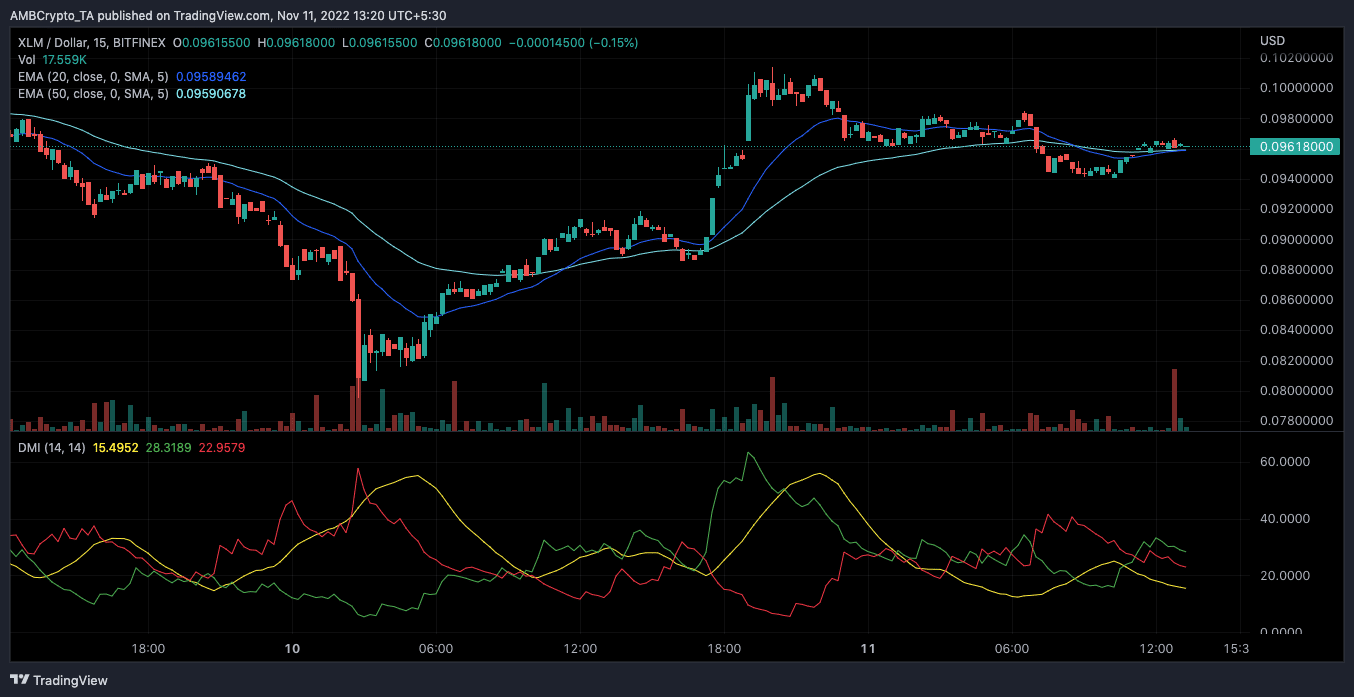
On the four-hour chart, XLM looked ready to give up the hold on its recent reclaim of the $0.09 region. This was because the Exponential Moving Average (EMA) indicated a struggle for authority.
At press time, the 50 EMA (cyan), which had initially regained control for sellers, was now in a bout with the 20 EMA (blue). This indicated that the next move of XLM would be to remain neutral.
For the Directional Movement Index (DMI), buyers (green) could still push XLM in the bullish direction. However, the Average Directional Index (ADX) showed that the buyer strength needed to be more solid for a further push.
XLM might need the ADX (yellow) to rise to 25. With the ADX at 15.49, XLM might find it challenging to regain the greens.


