Analysis
Stellar price prediction: Can XLM extend its recovery to 10% amid weak volume?
XLM appeared to be following September trend, will it log 10% recovery in October?
- Stellar annual event triggered slight interest in its native token XLM.
- Will the September trend repeat and extend XLM’s recovery to 10%?
Stellar blockchain, known for its robust cross-border payment support, saw a slight uptick in its native token, XLM, following its concluded Meridian 2024 conference in London, UK.
The annual event always showcases the chain’s development and new partnerships, especially in the payment ecosystem. However, despite the latest collaborations with MoneyGram, Paxos, and others, XLM only had a modest 8% jump.
Can XLM push forward?
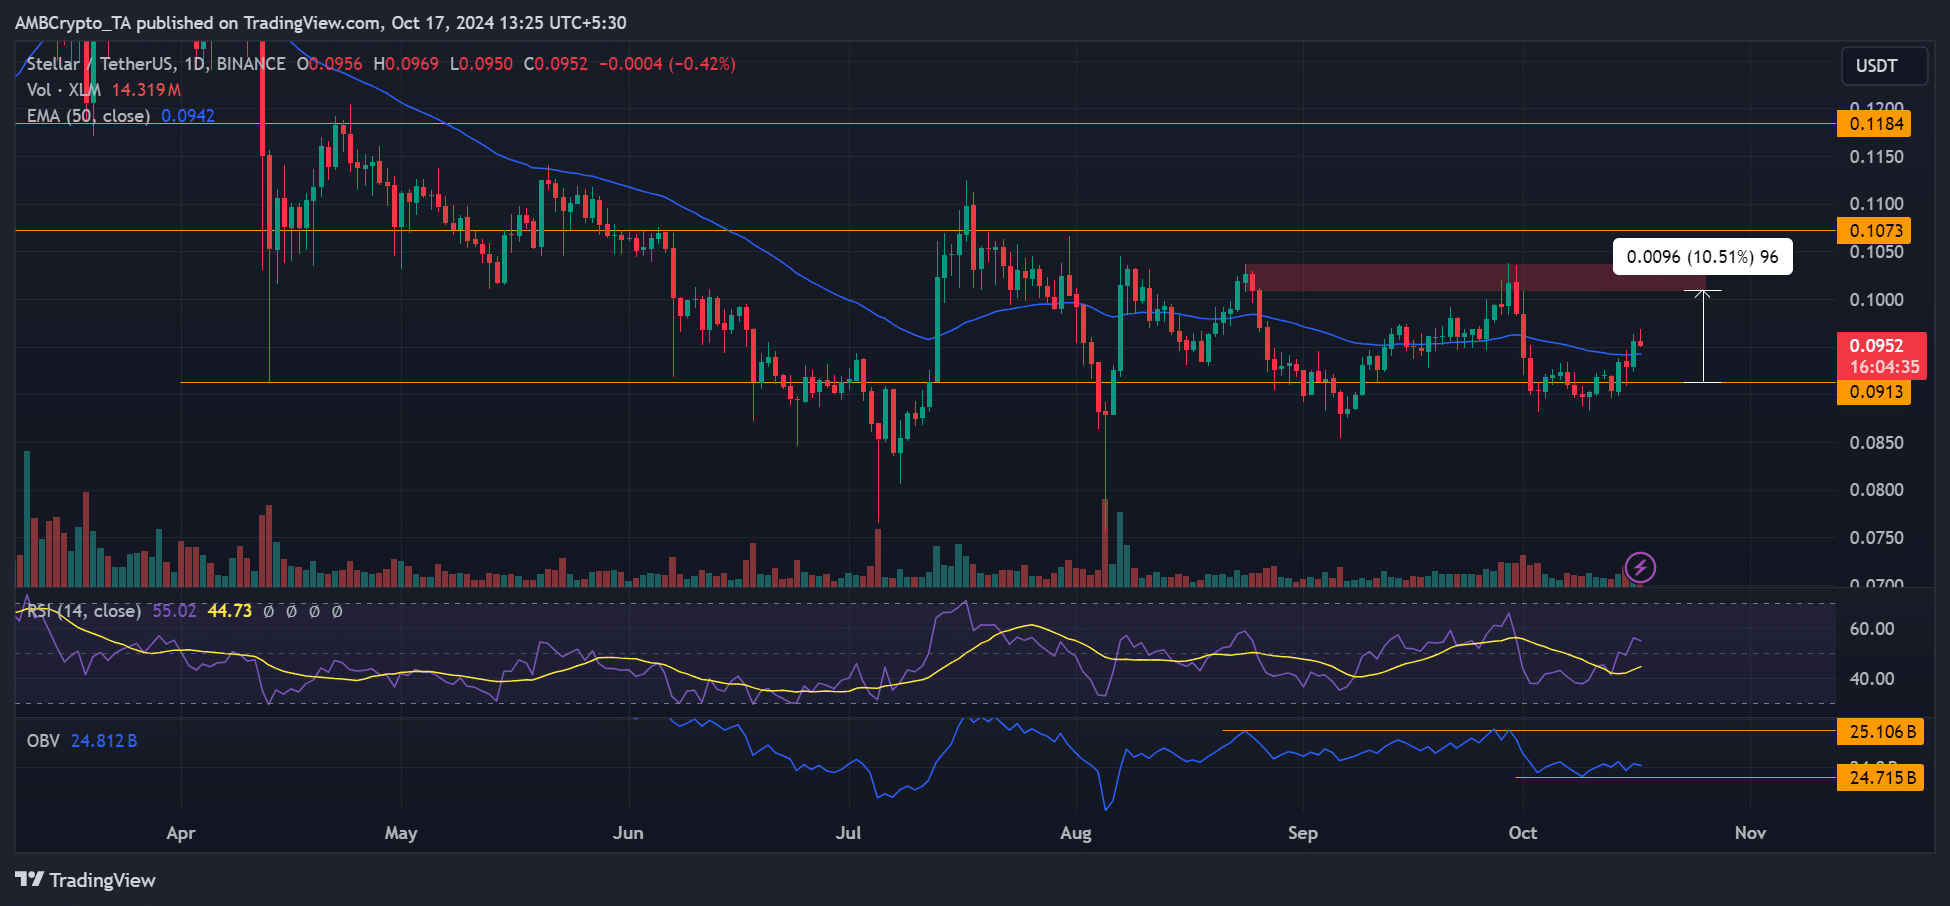
Source: XLM/USDT, TradingView
Since August’s massive sell-off, XLM has been stuck in a tight range between $0.09 and $0.10. Over the same period, $0.10 has been a local supply zone (marked red).
At press time, XLM had reclaimed the 50-day EMA (Exponential Moving Average). The last XLM reclaimed the dynamic support in September; it consolidated near it for a while before surging to the local supply area at $0.1.
If the trend repeats, XLM could hover near the 50-day EMA before extending its October recovery to 11%. The RSI’s northward movement indicated slow but steady growing buying pressure for the altcoin, which supported the bullish outlook.
However, the on-Balance Volume (OBV) was low and below the September peak, indicating that a strong bullish sentiment had not kicked in.
Stellar event impact
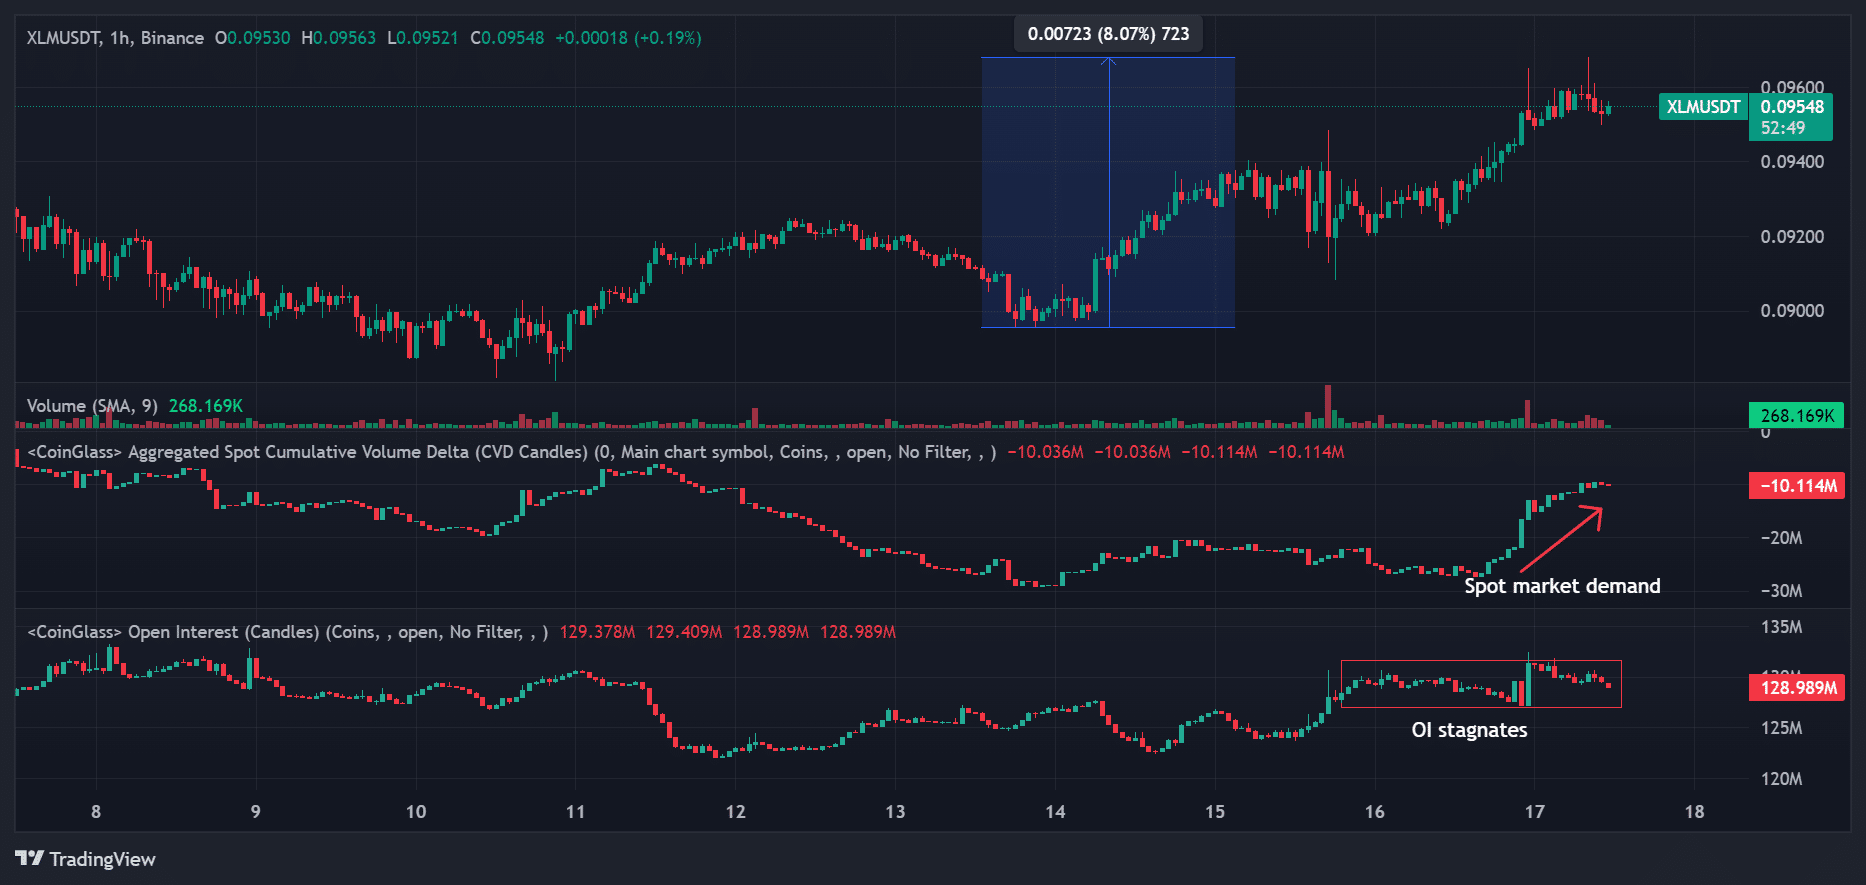
Source: XLM/USDT, TradingView
During the Stellar annual event, held from 15th to 17th October, there was a considerable surge in XLM spot market demand and interest in the futures market.
The CVD (Cumulative Volume Delta) spiked, illustrating increased spot market demand.
Similarly, open interest jumped from $123 million to $132 million, indicating strong interest amongst speculators in the futures market. In short, the event might have slightly boosted the XLM market.
Read Stellar [XLM] Price Prediction 2024-2025
That said, the XLM liquidation heatmap supported the price analysis findings. Notably, massive long positions (bright cluster) at $0.094 coincided with the 50-day EMA. This meant that the level could act as support in the short term.
Similarly, the overhead levels at $0.1 and $0.098 had increasing short positions, which were conceded with the local supply zone. Hence, these were key targets to track in the short term.
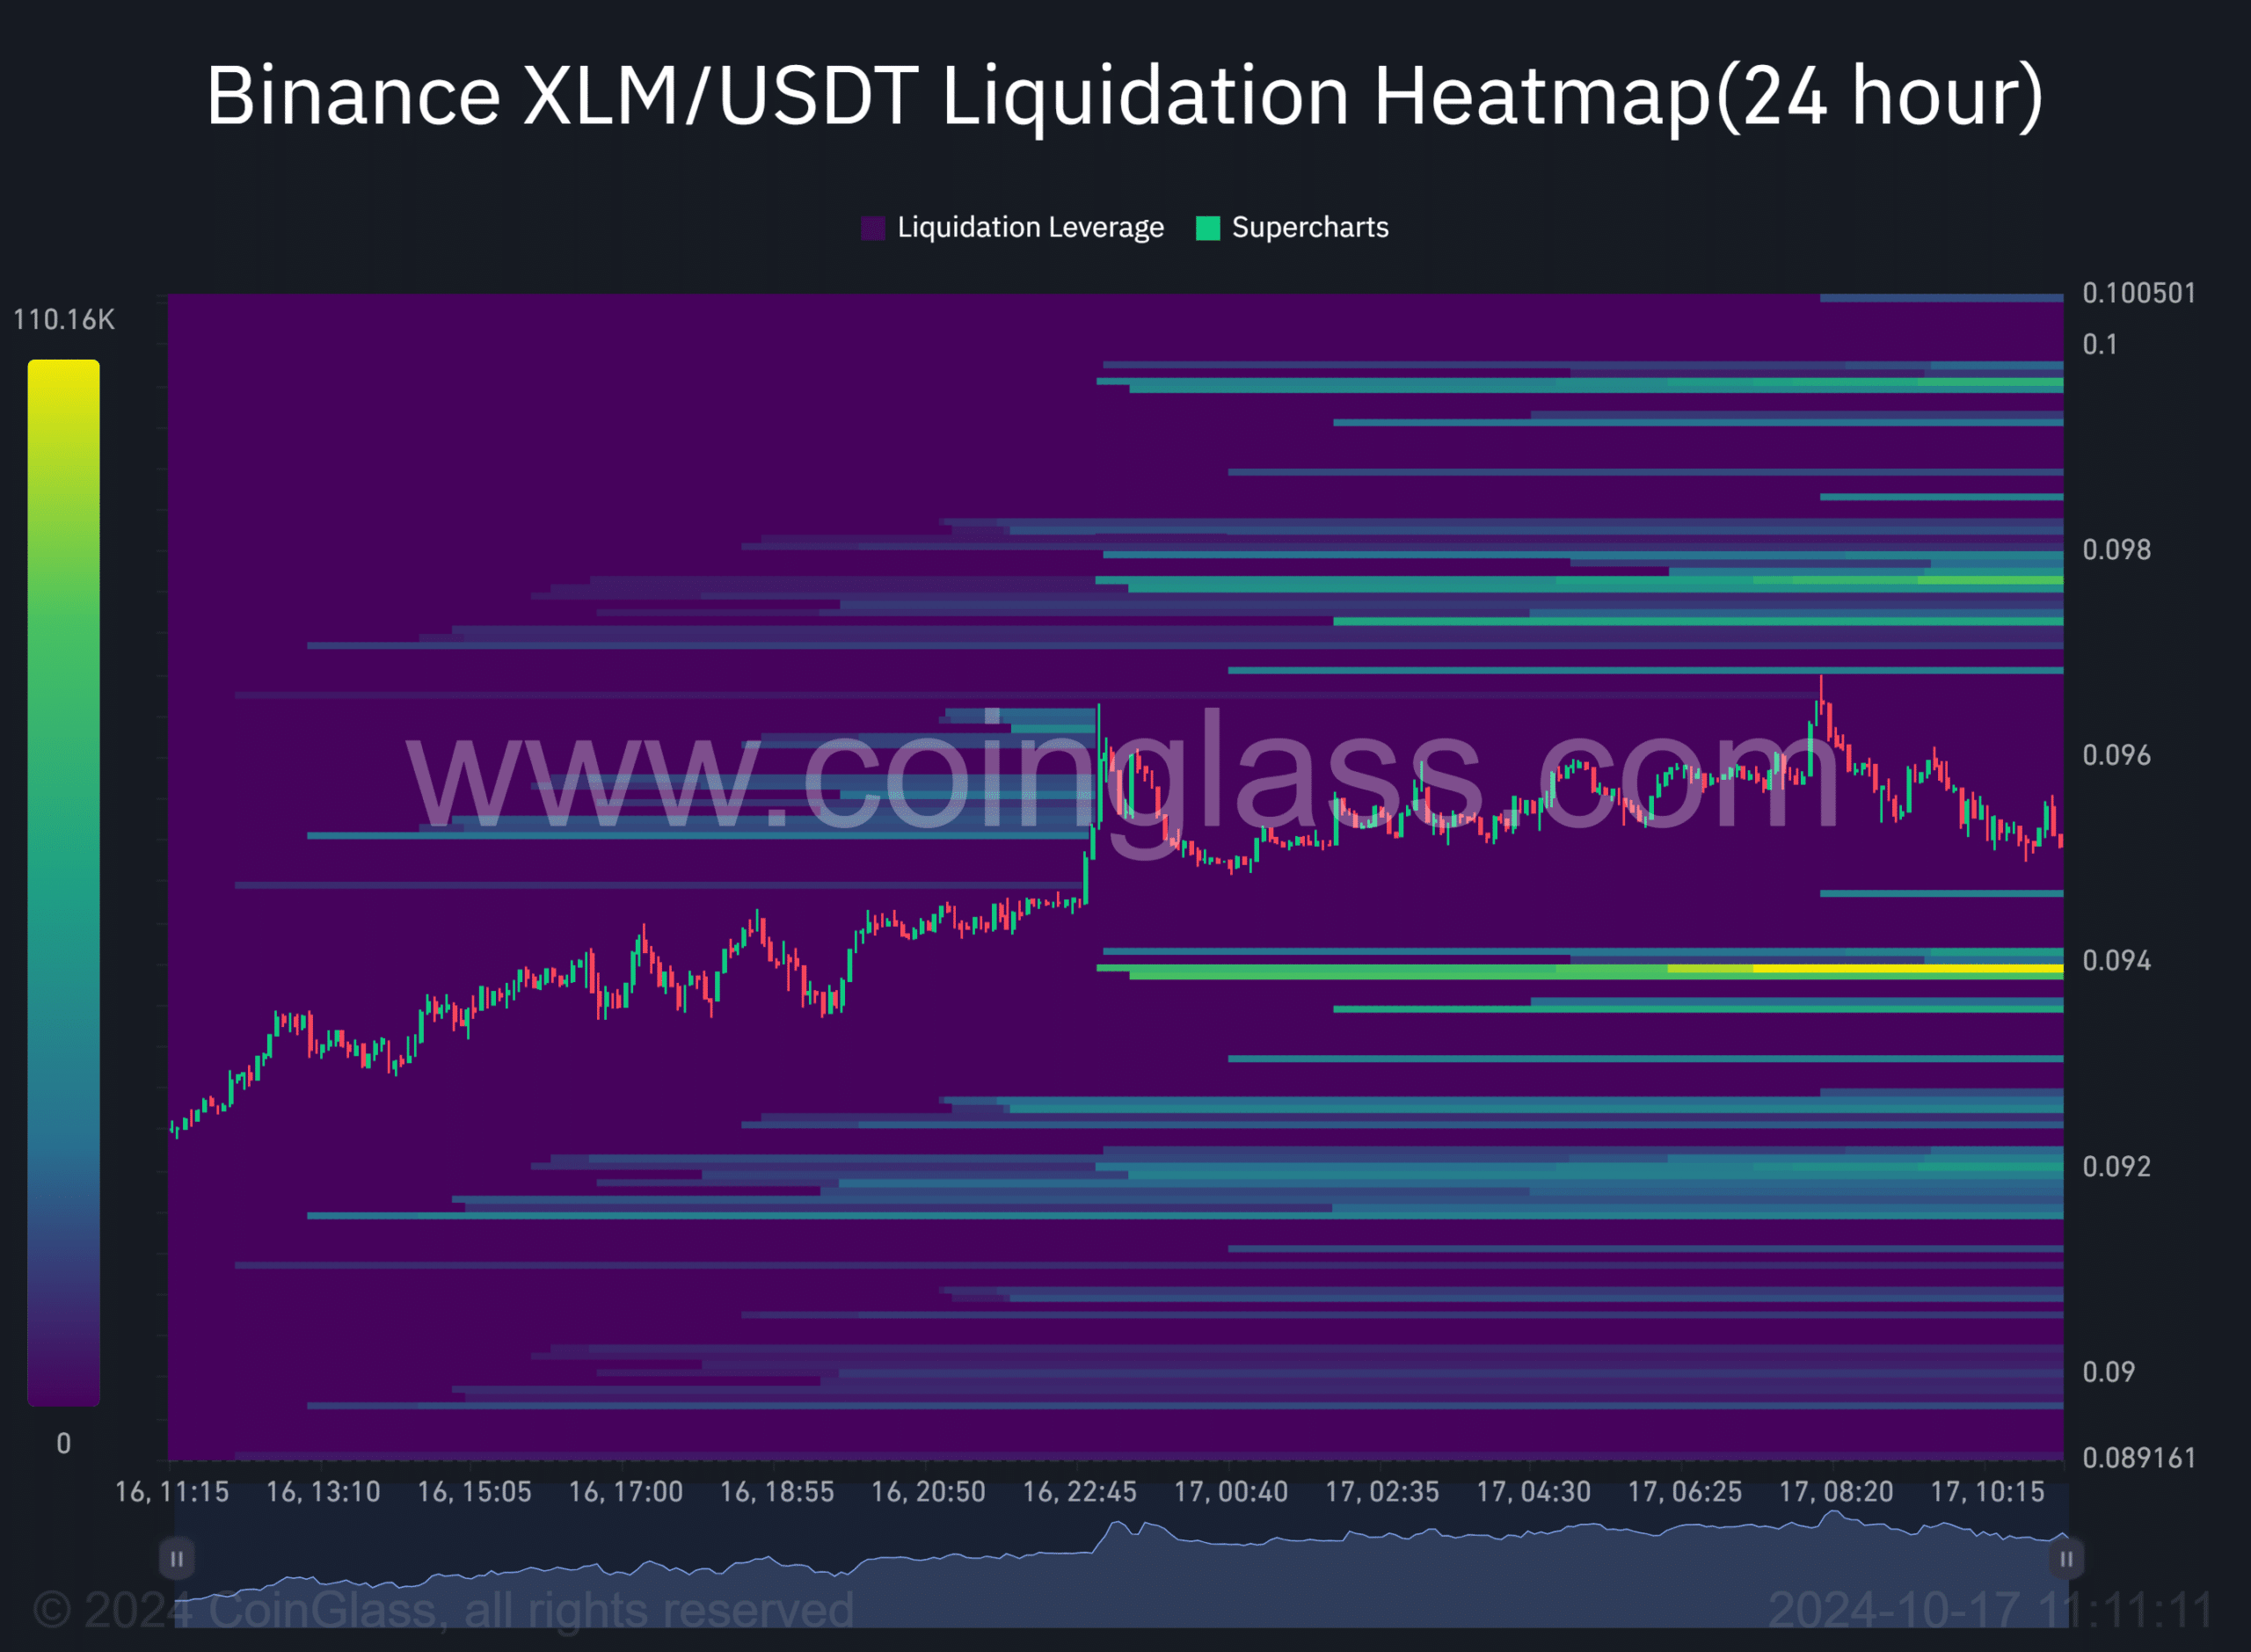
Source: Coinglass