Stellar struggles at the mid-range, will XLM prices dip

Disclaimer: The information presented does not constitute financial, investment, trading, or other types of advice and is solely the writer’s opinion.
- XLM fell back to its Q3 2022 range formation.
- Open Interest rates stagnated as funding rates fluctuated.
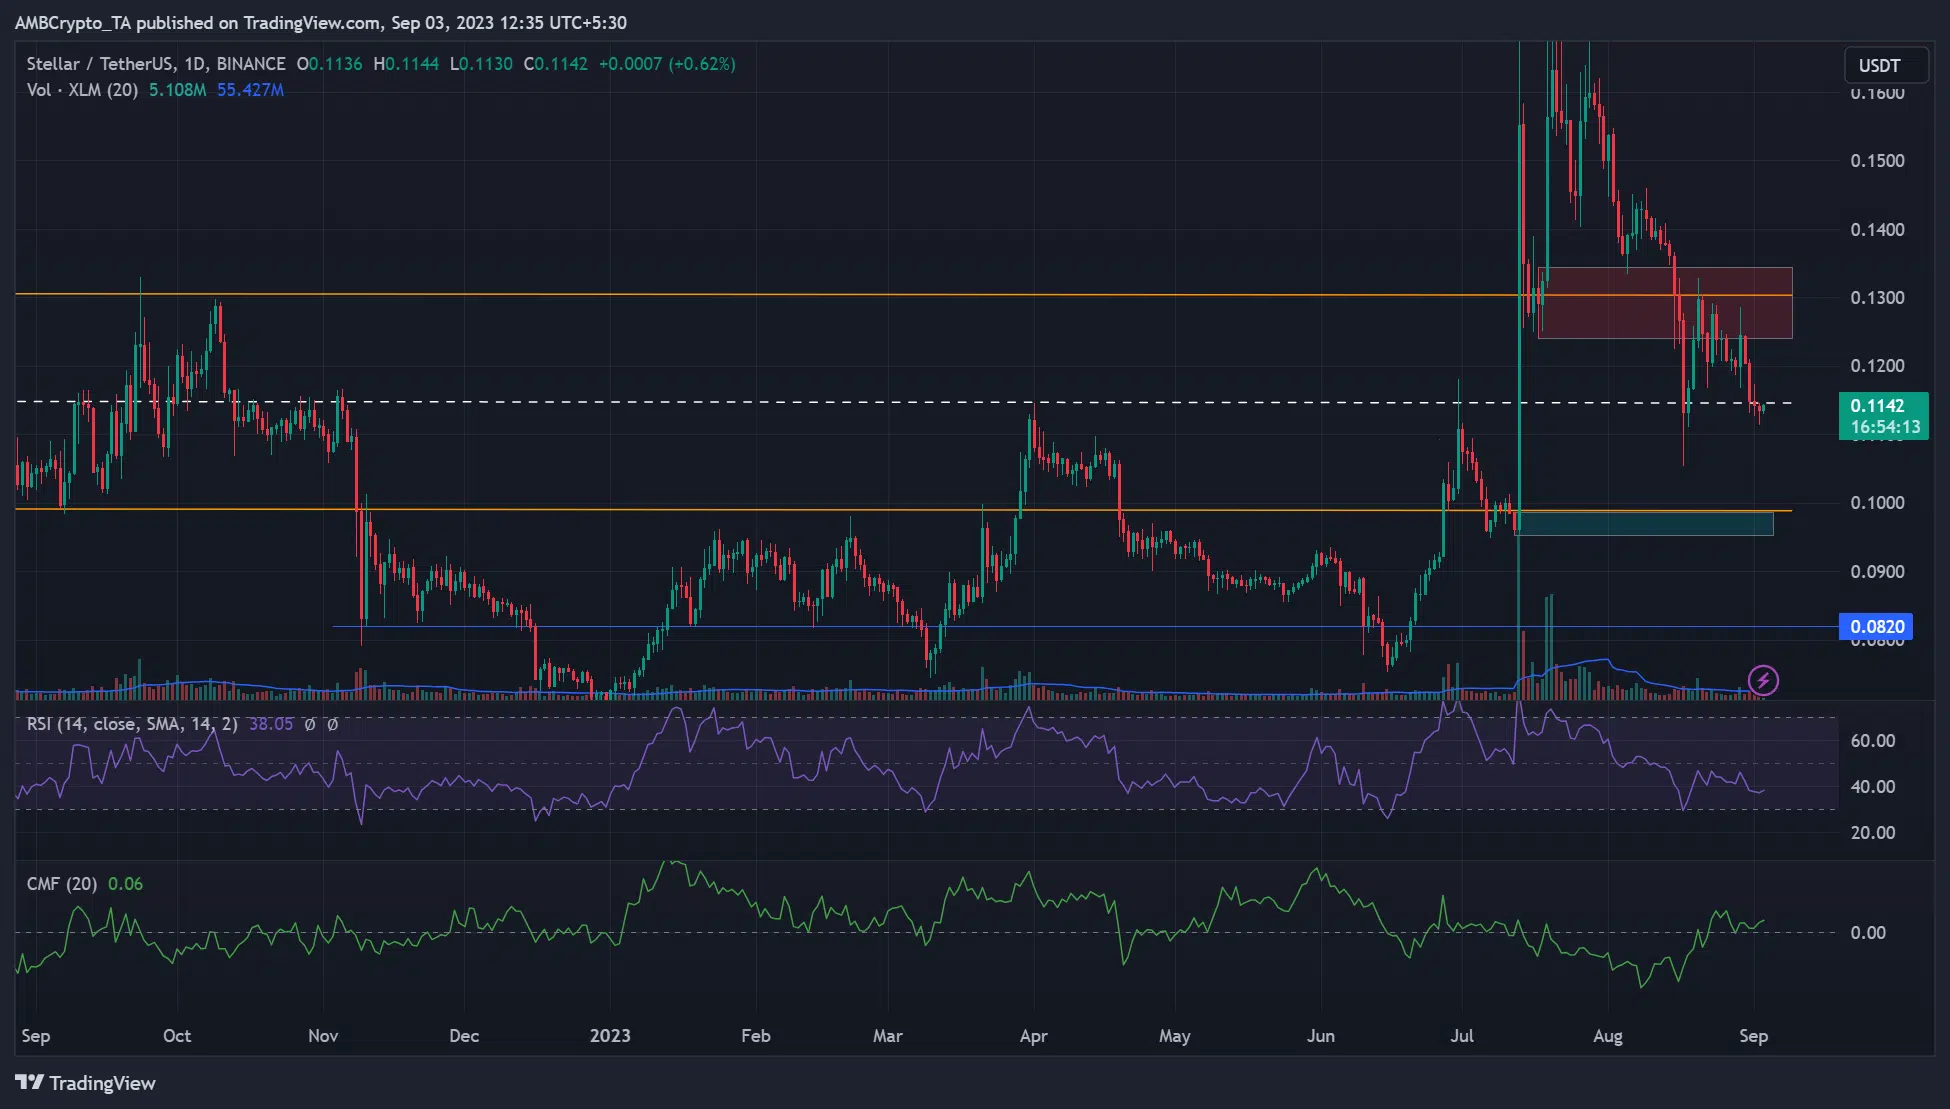
Stellar’s [XLM] price action has taken a cue from the Q3 2022 range formation. At press time, XLM breached the mid-range of $0.1150. It meant sellers could increasingly gain market control.
Is your portfolio green? Check out the APT Profit Calculator
In the meantime, Bitcoin [BTC] was stuck in its range-lows of $25k but struggled to reclaim $26k at press time.
Will sellers push XLM lower?
In Q3 2022, XLM oscillated between $0.0991 – $0.1303, yellow parallel channel. The extended pullback in August eased at the mid-range of $0.1150. An attempted recovery was blocked at the range-high near $0.1300, tipping XLM to crack the mid-range.
Since 1 September, XLM closed daily sessions below the mid-range ($0.1150). It denotes increasing seller leverage. A weekly session close below the same level could confirm sellers’ advancement.
If so, sellers could push XLM to the range low near $0.1000. The range low has a confluence with a daily bullish OB of $0.0953 – $0.0986 (cyan), making the area a solid bullish zone.
The RSI fluctuated below the 50 mark, reinforcing the muted buying pressure and bearish bias described above. However, the CMF wavered above zero, meaning capital inflows fluctuated.
XLM had negative readings
In the last few days, funding rates were negative overall, underscoring the bearish bias witnessed across the crypto market over the same period. The bias was confirmed by the declining Open Interest (OI) rates over the same duration. It demonstrates demand for XLM dropped in August and extended to early September.
Is your portfolio green? Check out the XLM Proft Calculator
However, the CVD (Cumulative Volume Delta) improved in September. The metric tracks whether sellers or buyers have market control. The improvement suggests buyers regained little market control.
But the flat OI and a BTC stuck in the range low could favor XLM sellers. Traders should track BTC price movement for a better-optimized set-up.


